
There's a super cycle, you say? Part 2
There's a super cycle, you say? Part 2
Transitory supply chain constraints across U.S. shale likely delay supply acceleration until 2H22'

Part 2: U.S. Supply
In our last post, we showed that demand is still growing, but at a slower pace than in 21’. Now, what about supply growth?
Breaking the supply equation in two posts: US and OPEC+. The remainder of this post will focus on US production, and the drivers for growth over the next year. OPEC+ supply and the Global factors will be covered in Part 3.
Out of everything…for now
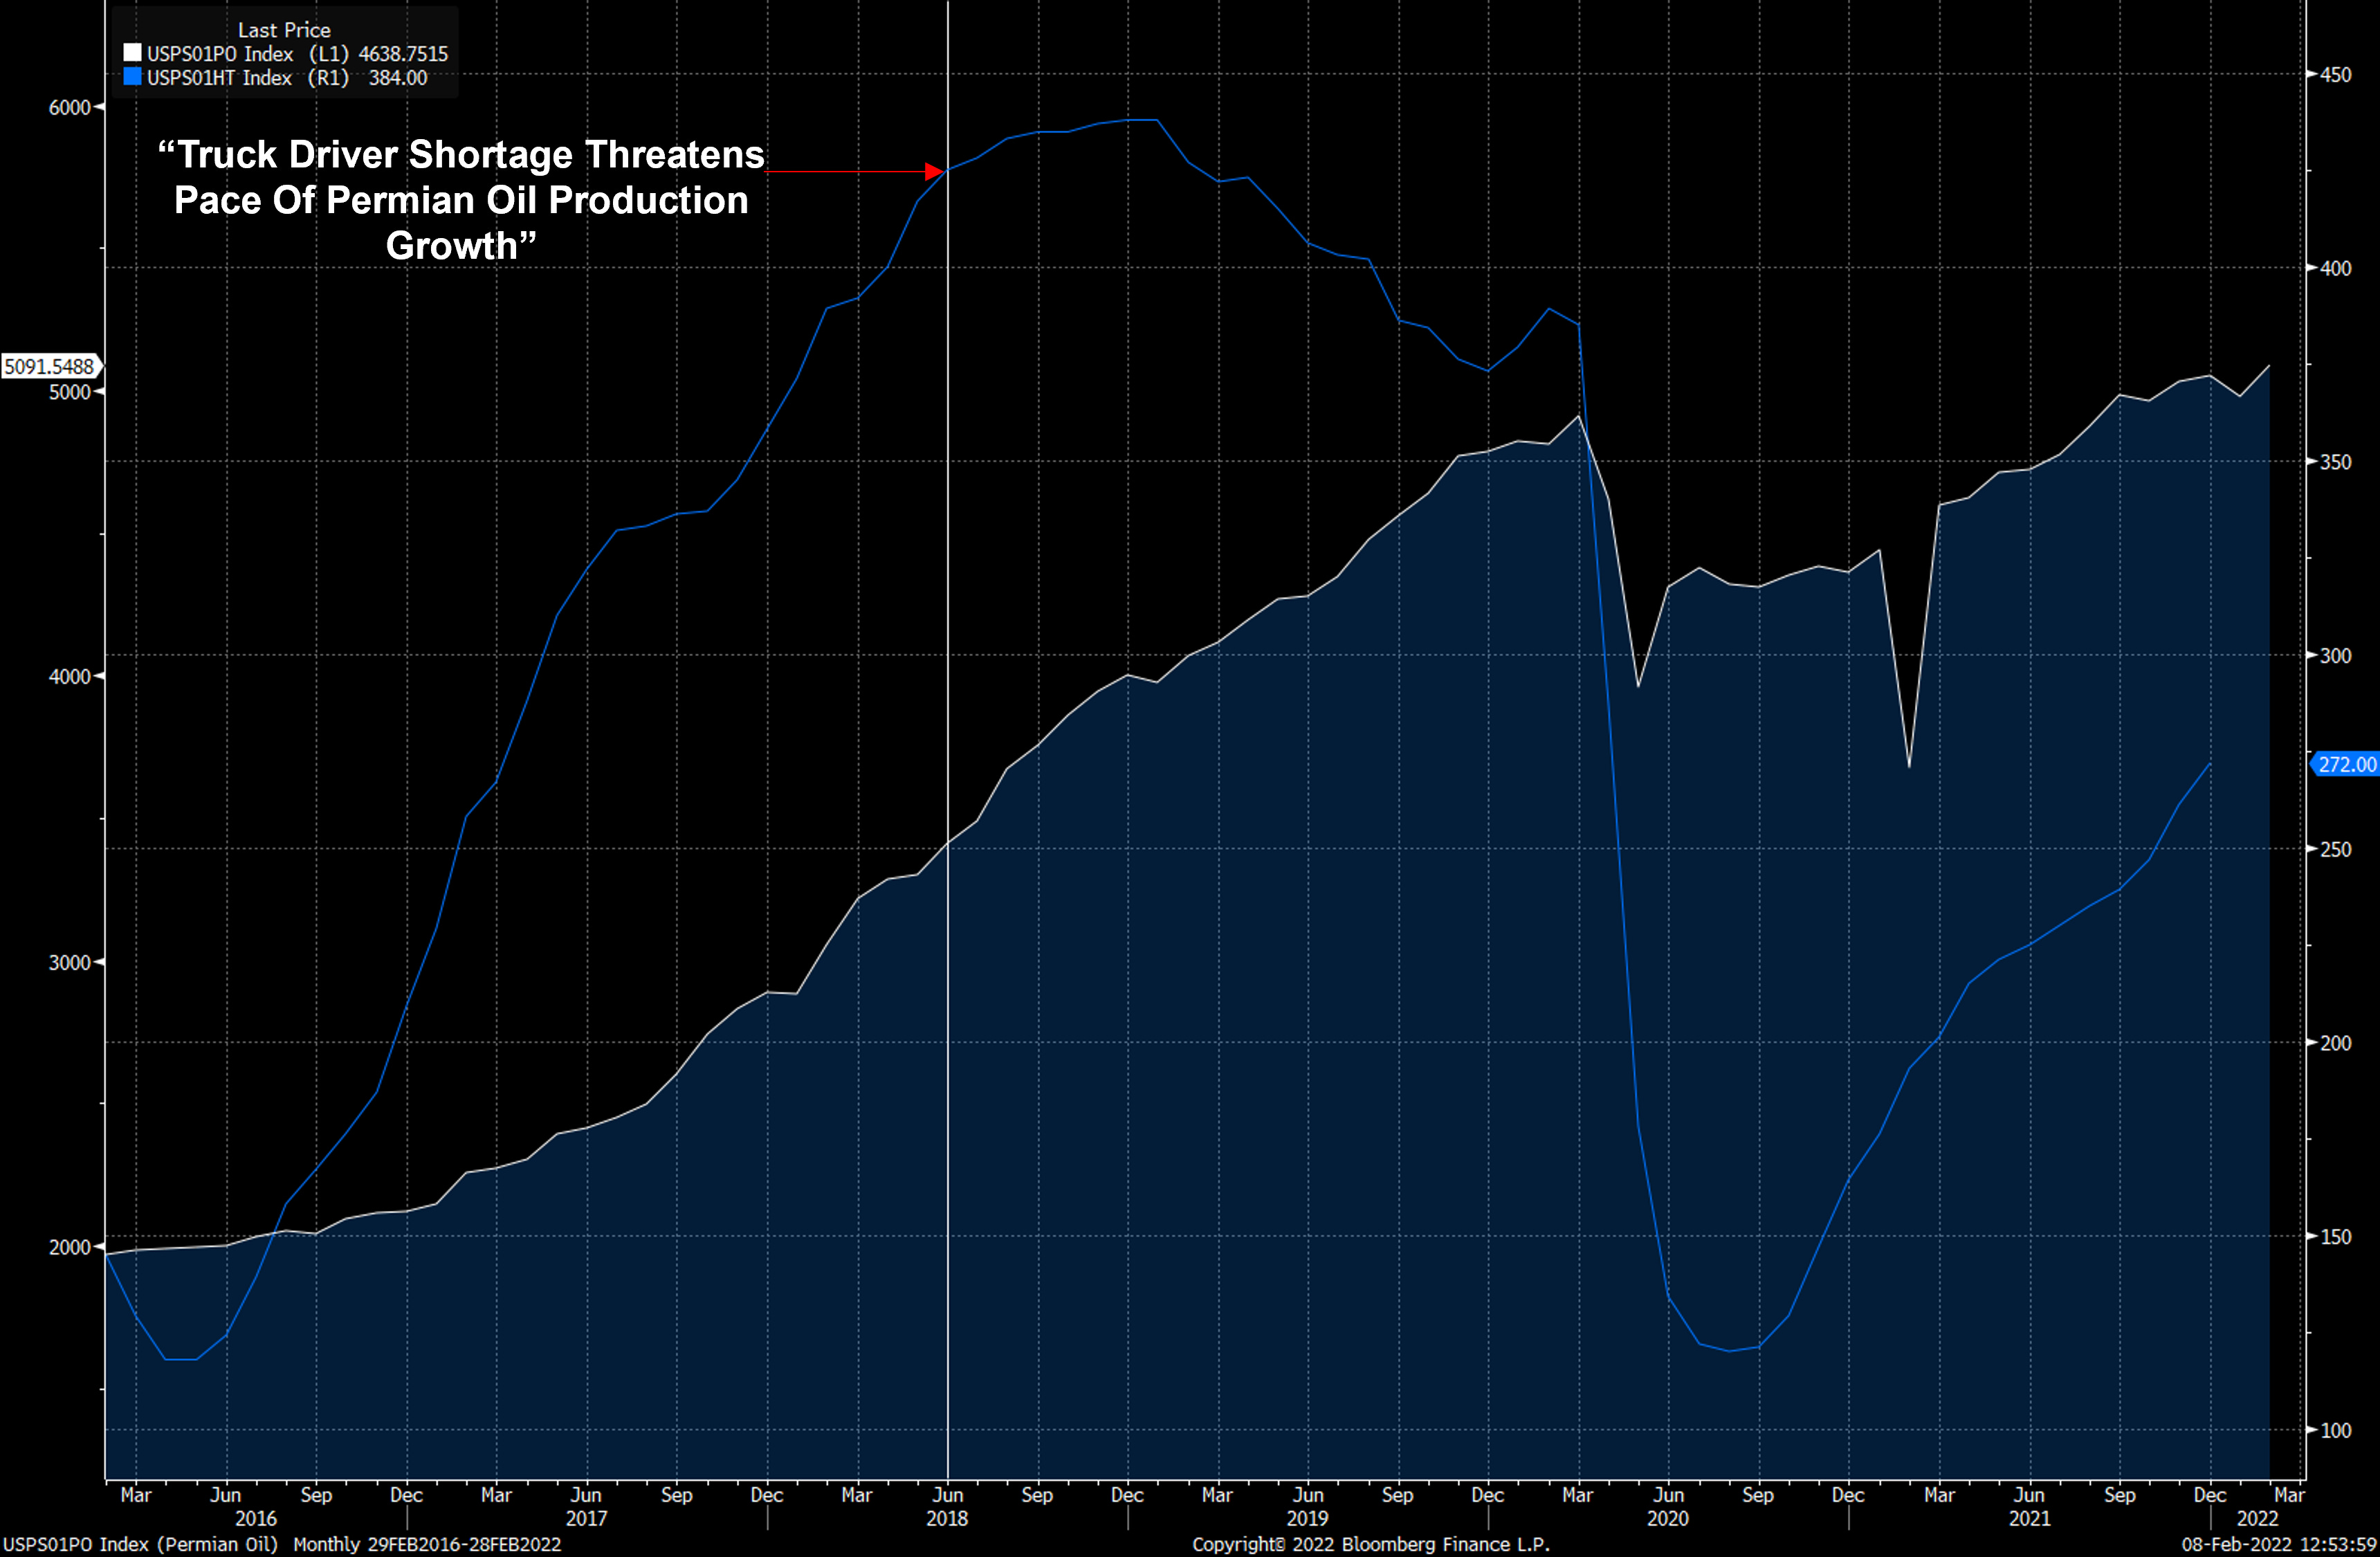
You may have seen headlines recently around significant tightness in the oilfield service supply chain. These concerns are not new, and something that was talked about quite a bit when the Permian was growing at 1mmbbl/d in 2018.
“Could a shortage of oilfield truck drivers collide with rising Permian rig count—already at an all-time high for horizontal work—and ever-growing volumes of sand per well and greater volumes of produced water (both of which use trucking for conveyance) to slow the rate of regional oil production?’
- Richard Mason, Hart Energy June 2018
History has shown peak pain does not last when it comes to the shortages of cyclical goods. For oil and gas specifically, we compared the number of times the word “shortage” was used in public oil and gas filings vs. North American (“NAM”) OFS Capex. This gives a sense of how fast do service companies respond to the shortages seen across the value chain. Interestingly (or intuitively), when references to a “shortage” peaked, capex peaked within 1-2 quarters. The gap between the two points is where all the pain is.
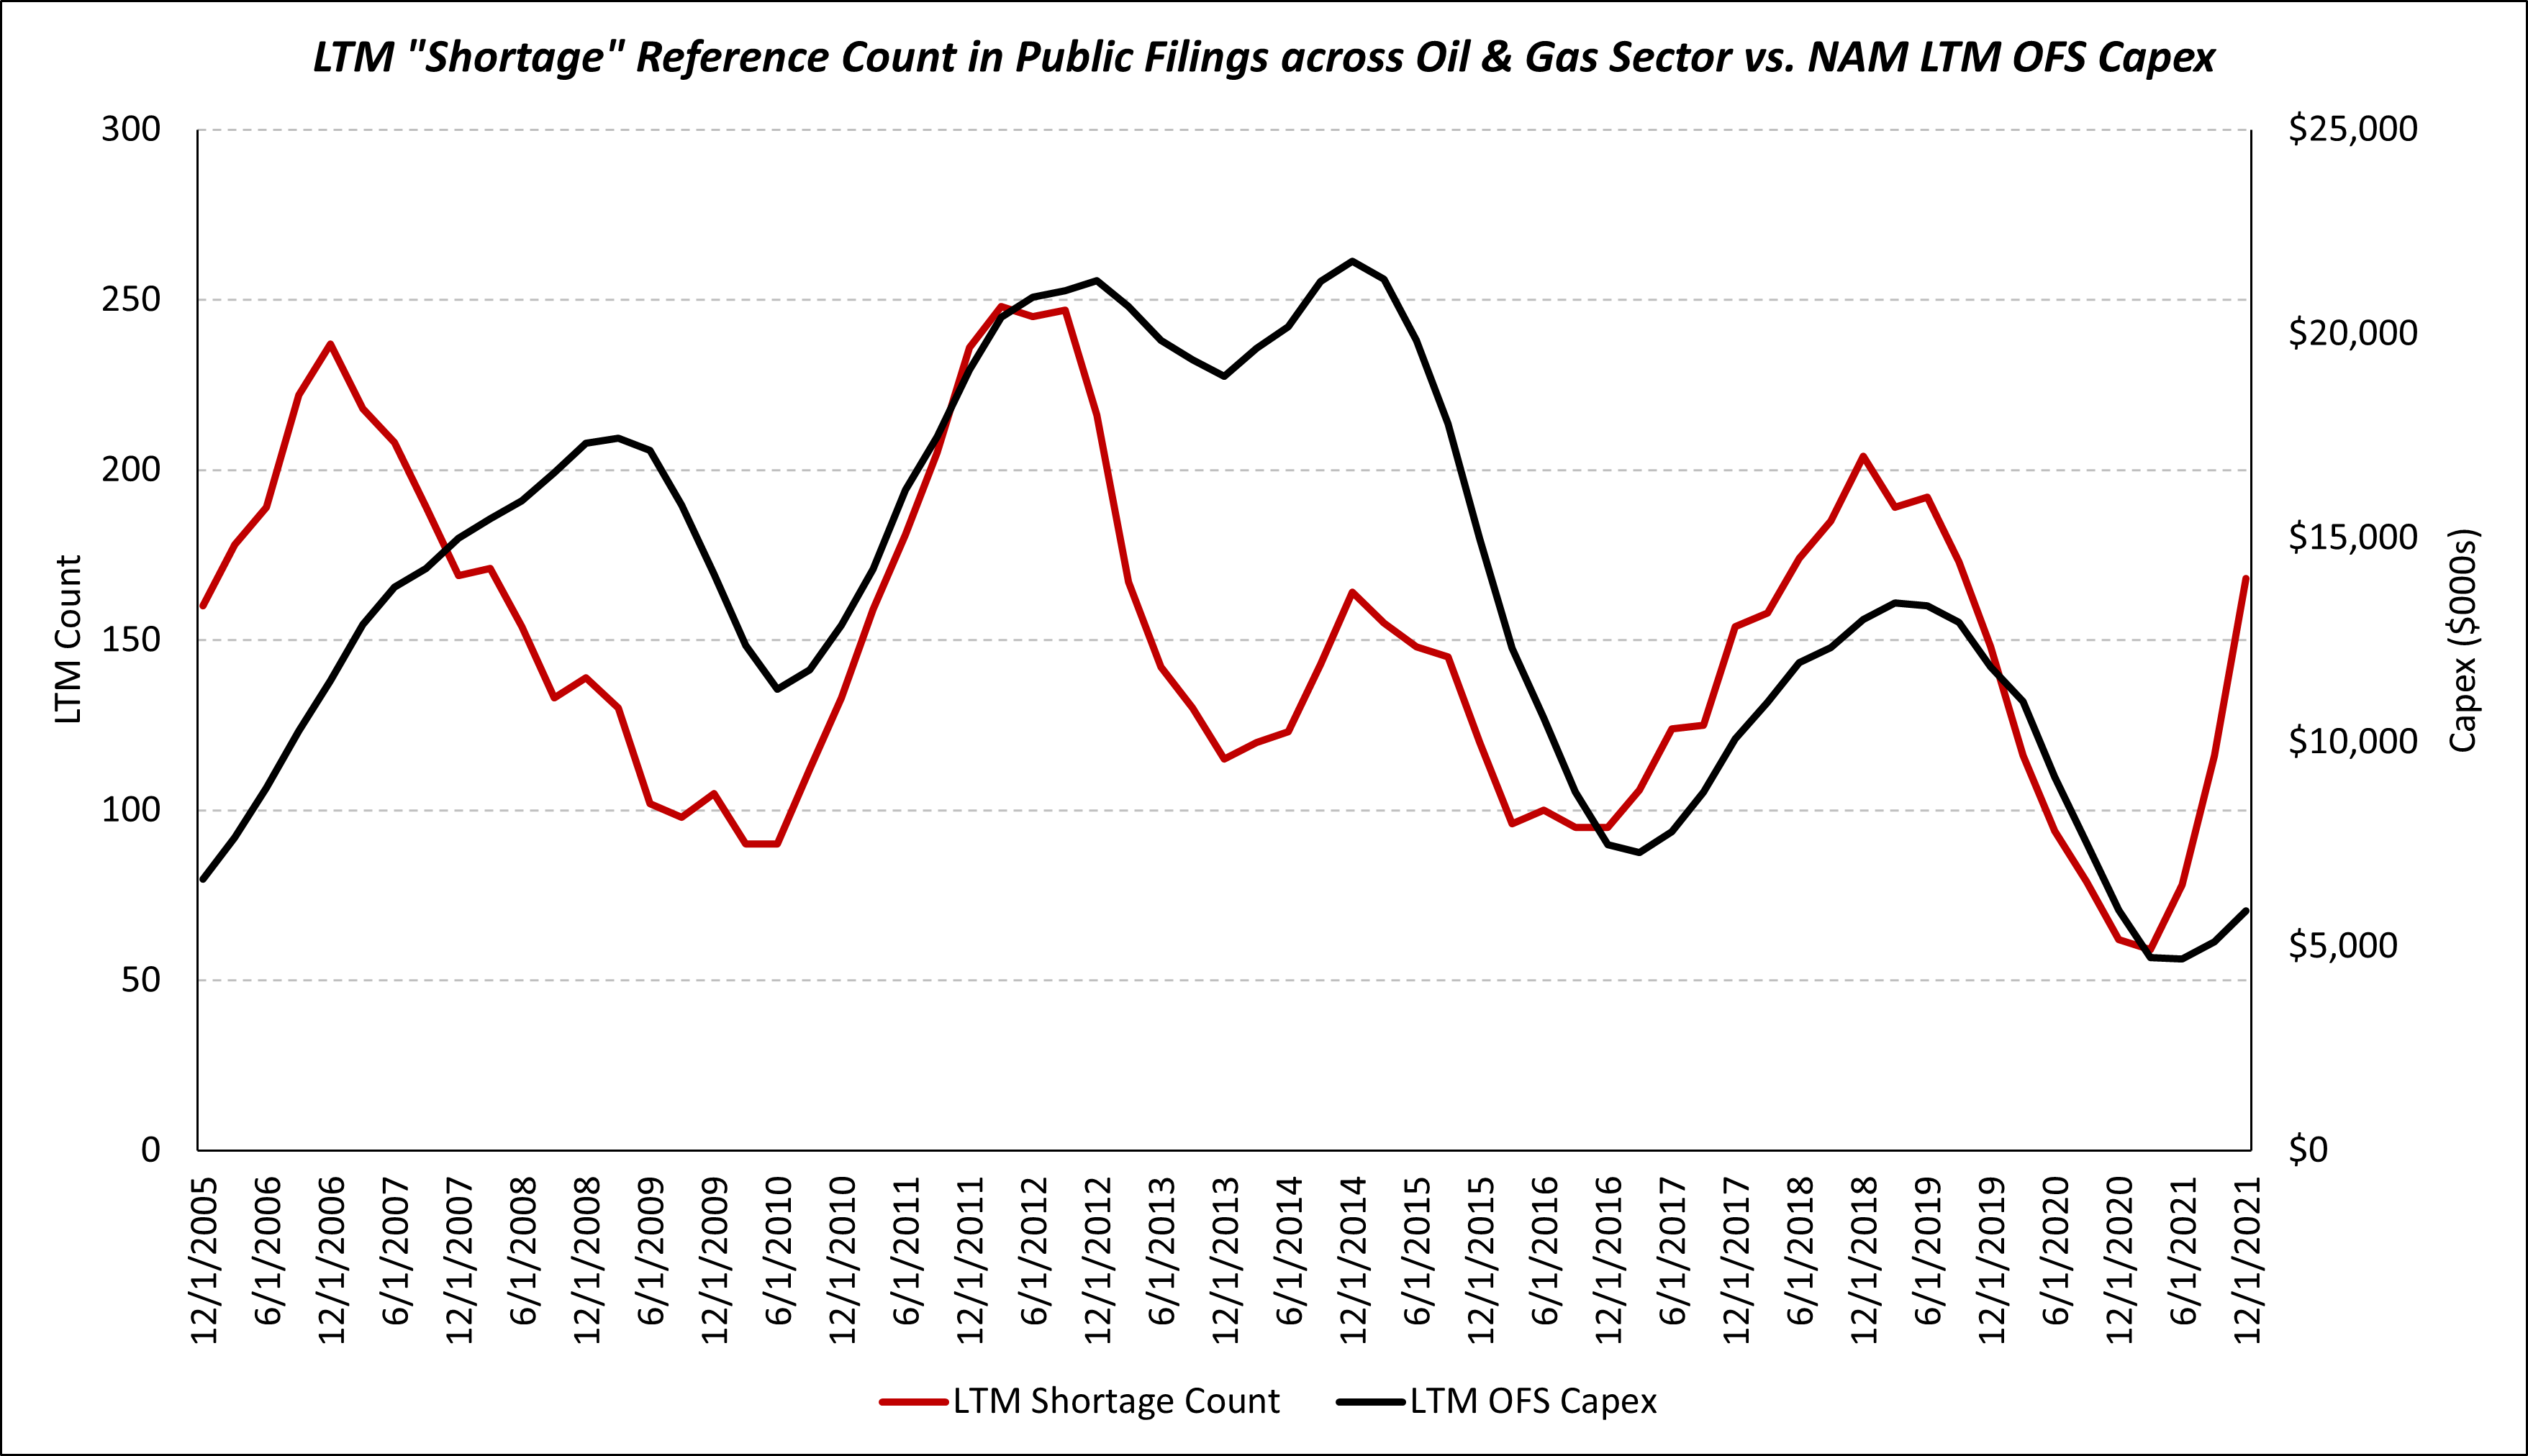
We are in the period where peak pain is being felt by service companies and producers. However, help is on the way. OFS capex has already come off the bottom, and is likely to grow another 30-40% in 22’.
The Great Bottleneck
Activity Ramp Enemy #1: Casing
The biggest bottleneck in 21’ was casing. The significant DUC inventory (drilled-but-uncompleted wells) allowed operators to ramp completions activity without needing to ramp rigs. Since July 20’, DUCs drew down by ~4,200 to ~4,600 as of last report.
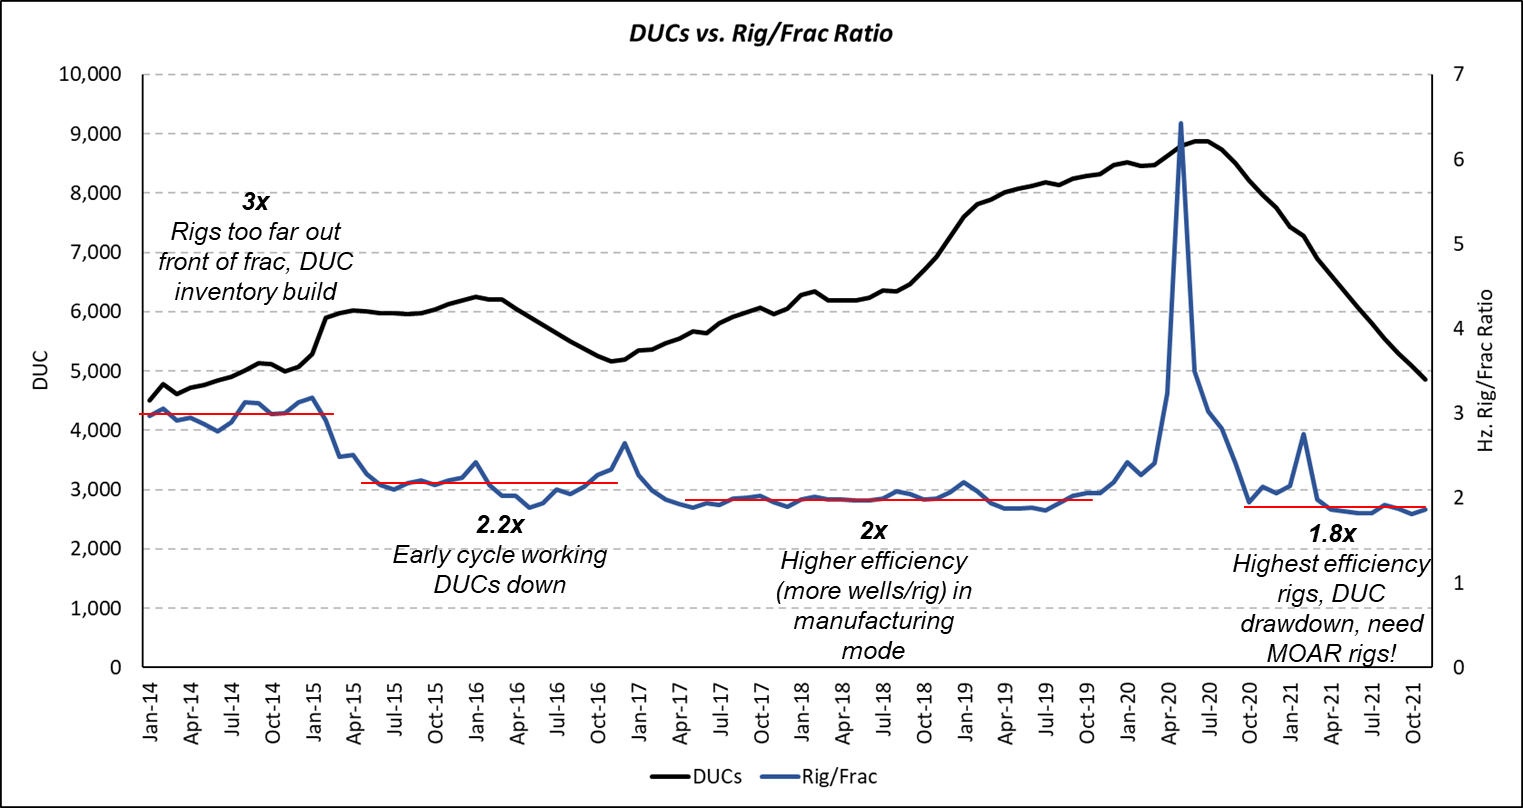
During that period, the rig to frac ratio was ~1.8. With increased efficiencies, operators now only need ~2 to 2.2 rigs per frac crew. As the DUC inventory normalized, operators needed to add rigs. This is where the problem was exacerbated.
There are numerous factors for this, but simply steel prices skyrocketed as input costs rose, which forced mills to reduce capacity. Typically, HRC (hot rolled coil) prices lead OCTG prices (looking at J55 below) by ~3-6 months.
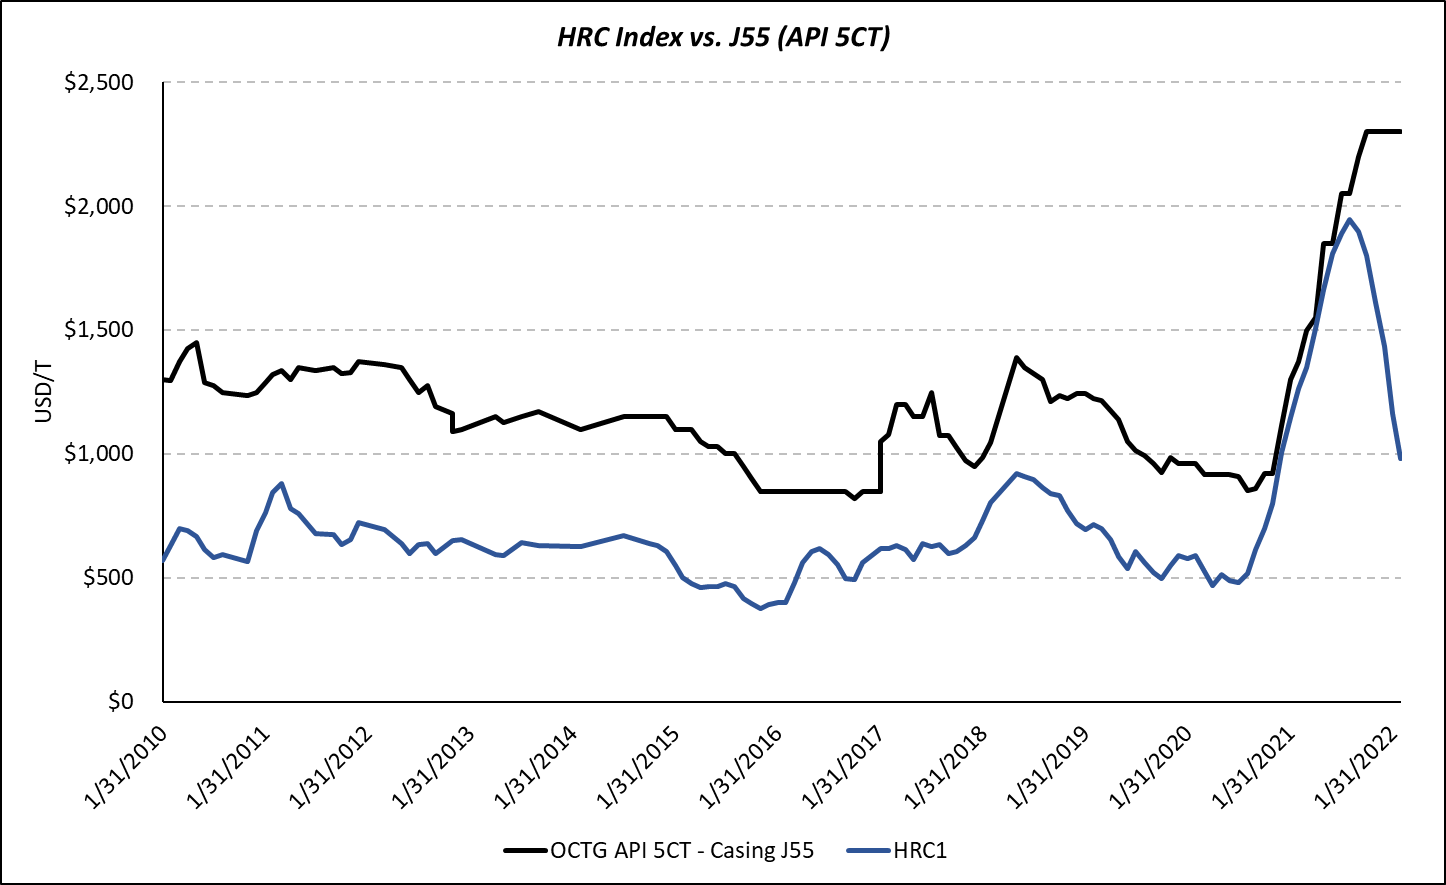
HRC prices are down ~50% from the highs in late 21’. As they continue falling, OCTG availability is likely to increase (ie. more mill capacity comes online). Cost reductions to operators may be muted, as companies like Vallourec and Tenaris will want to see margins expand. However, we expect casing availability to increase in mid to late 2Q22’. With ramping casing availability, operators will then be able to increase rig count in the second half of the year. Earnings releases from Vallourec (2/24/22) and Tenaris (2/16/22) will be early indicators of how this is evolving in real-time.

Activity Ramp Enemy #2: Labor
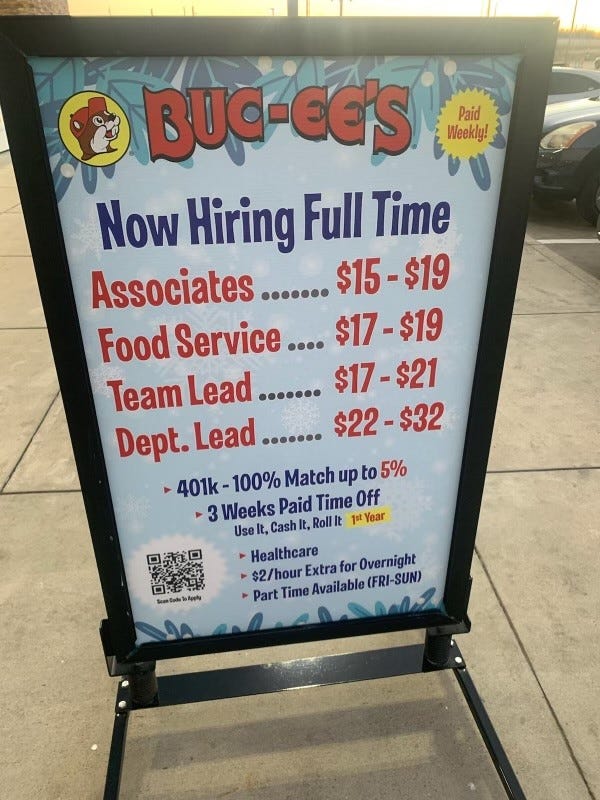
Tightness in the labor market has been an issue across the economy. This flows through to multiple segments of the oil and gas industry, but we will focus on trucking and field personnel. Below is a picture from a friend in San Antonio (near the Eagle Ford). This is an example of what service and trucking companies are competing with. Would you rather work 80-100hrs a week in the field, or in an air conditioned building 40-60hrs/week with full benefits and paid vacation? As of late, the answer has been clear (hint: its the air conditioned building).
The big question is how does this dynamic evolve with covid related subsidies rolling off and savings depleted?
US savings has nearly erased the gains seen during the pandemic, down to ~$1.43tln. This is still up ~$241bn from pre-pandemic levels.

With savings reduced, and covid era benefits largely expired, workers are incentivized to enter the labor force and seek employment. Current labor participation rate is ~82%. If we get back to pre-covid levels of ~83% that implies an additional ~1.5mm people in the labor force.

Additional workers are likely to come from those not in the labor force, but who do want a job. If we get back to pre-covid levels that implies an additional ~0.86mm jobs.

In total, normalization of the labor force implies an additional 2.4mm workers entering the labor force. In addition to the above, we are watching the JOLTS job openings data closely. A decline in total job openings combined with increasing labor force is likely to put downward pressure on labor shortages across the supply chain. The flow through to oil and gas means more workers.

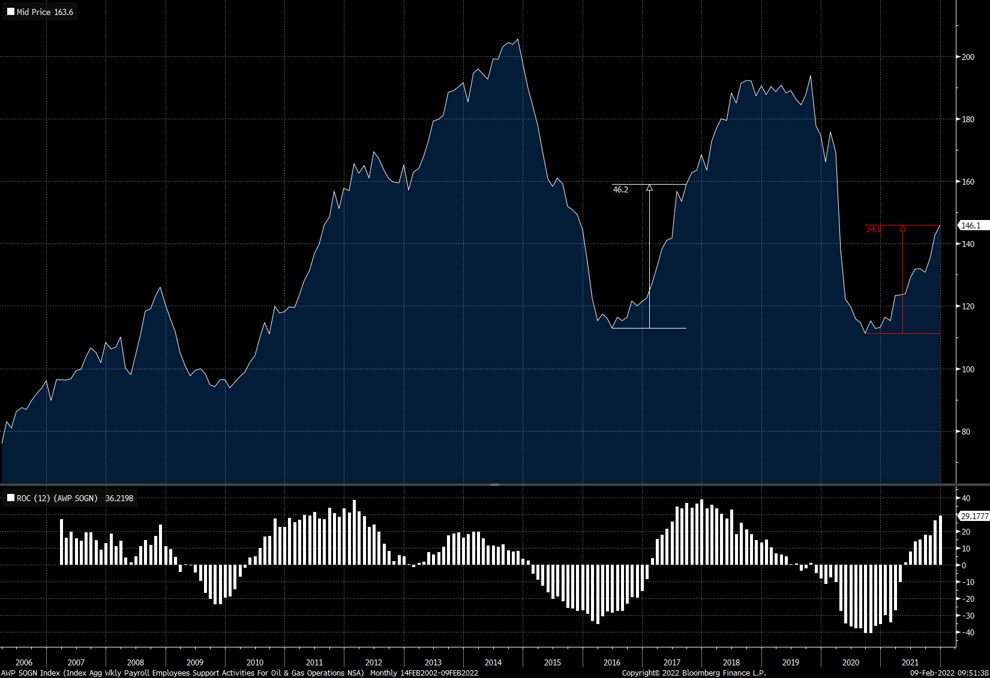
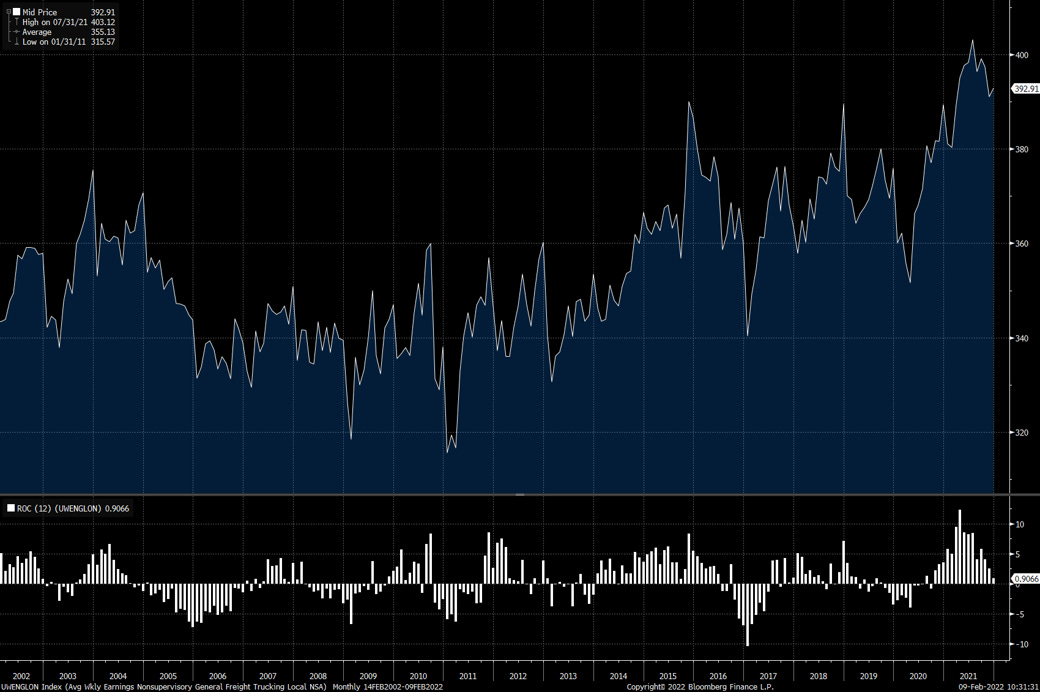
We are still well below the 2018 level of employment for oil and gas support activities (146k today vs. 192k in 2018). However, the pace of job adds only lags by ~11k jobs. That is in the face of a very tight job market across the U.S. As wages continue to accelerate across the oil and gas industry, while other industries likely see a deceleration, we an acceleration of oil and gas employment in 22’ is likely. The key here is more labor, but at the same time rising wages in the industry. Pressure on the supply chain likely eases, but margin pressure from persistently higher wages is likely to remain.
The last point here is interesting, and one we are still thinking through the causes/implications. We looked at the ratio of support activity workers to rigs + frac crews. The results were surprising. The bumps during down turns make sense, with equipment idling faster than employees getting laid off. The gradual rise over time is what catches our eye, and we think is indicative of rising labor intensity of operations for service companies.
For producers, production per service worker has gradually risen over time.

This dynamic is one that service companies will have to resolve quickly as operators are reluctant to accept price increases and ask service companies to continue doing more (simul frac, faster drilling, etc.).
Activity Enemy #3: Trucking
Trucking is a big problem right now, but as alluded to in the intro this has been an issue before. It didn’t last forever.
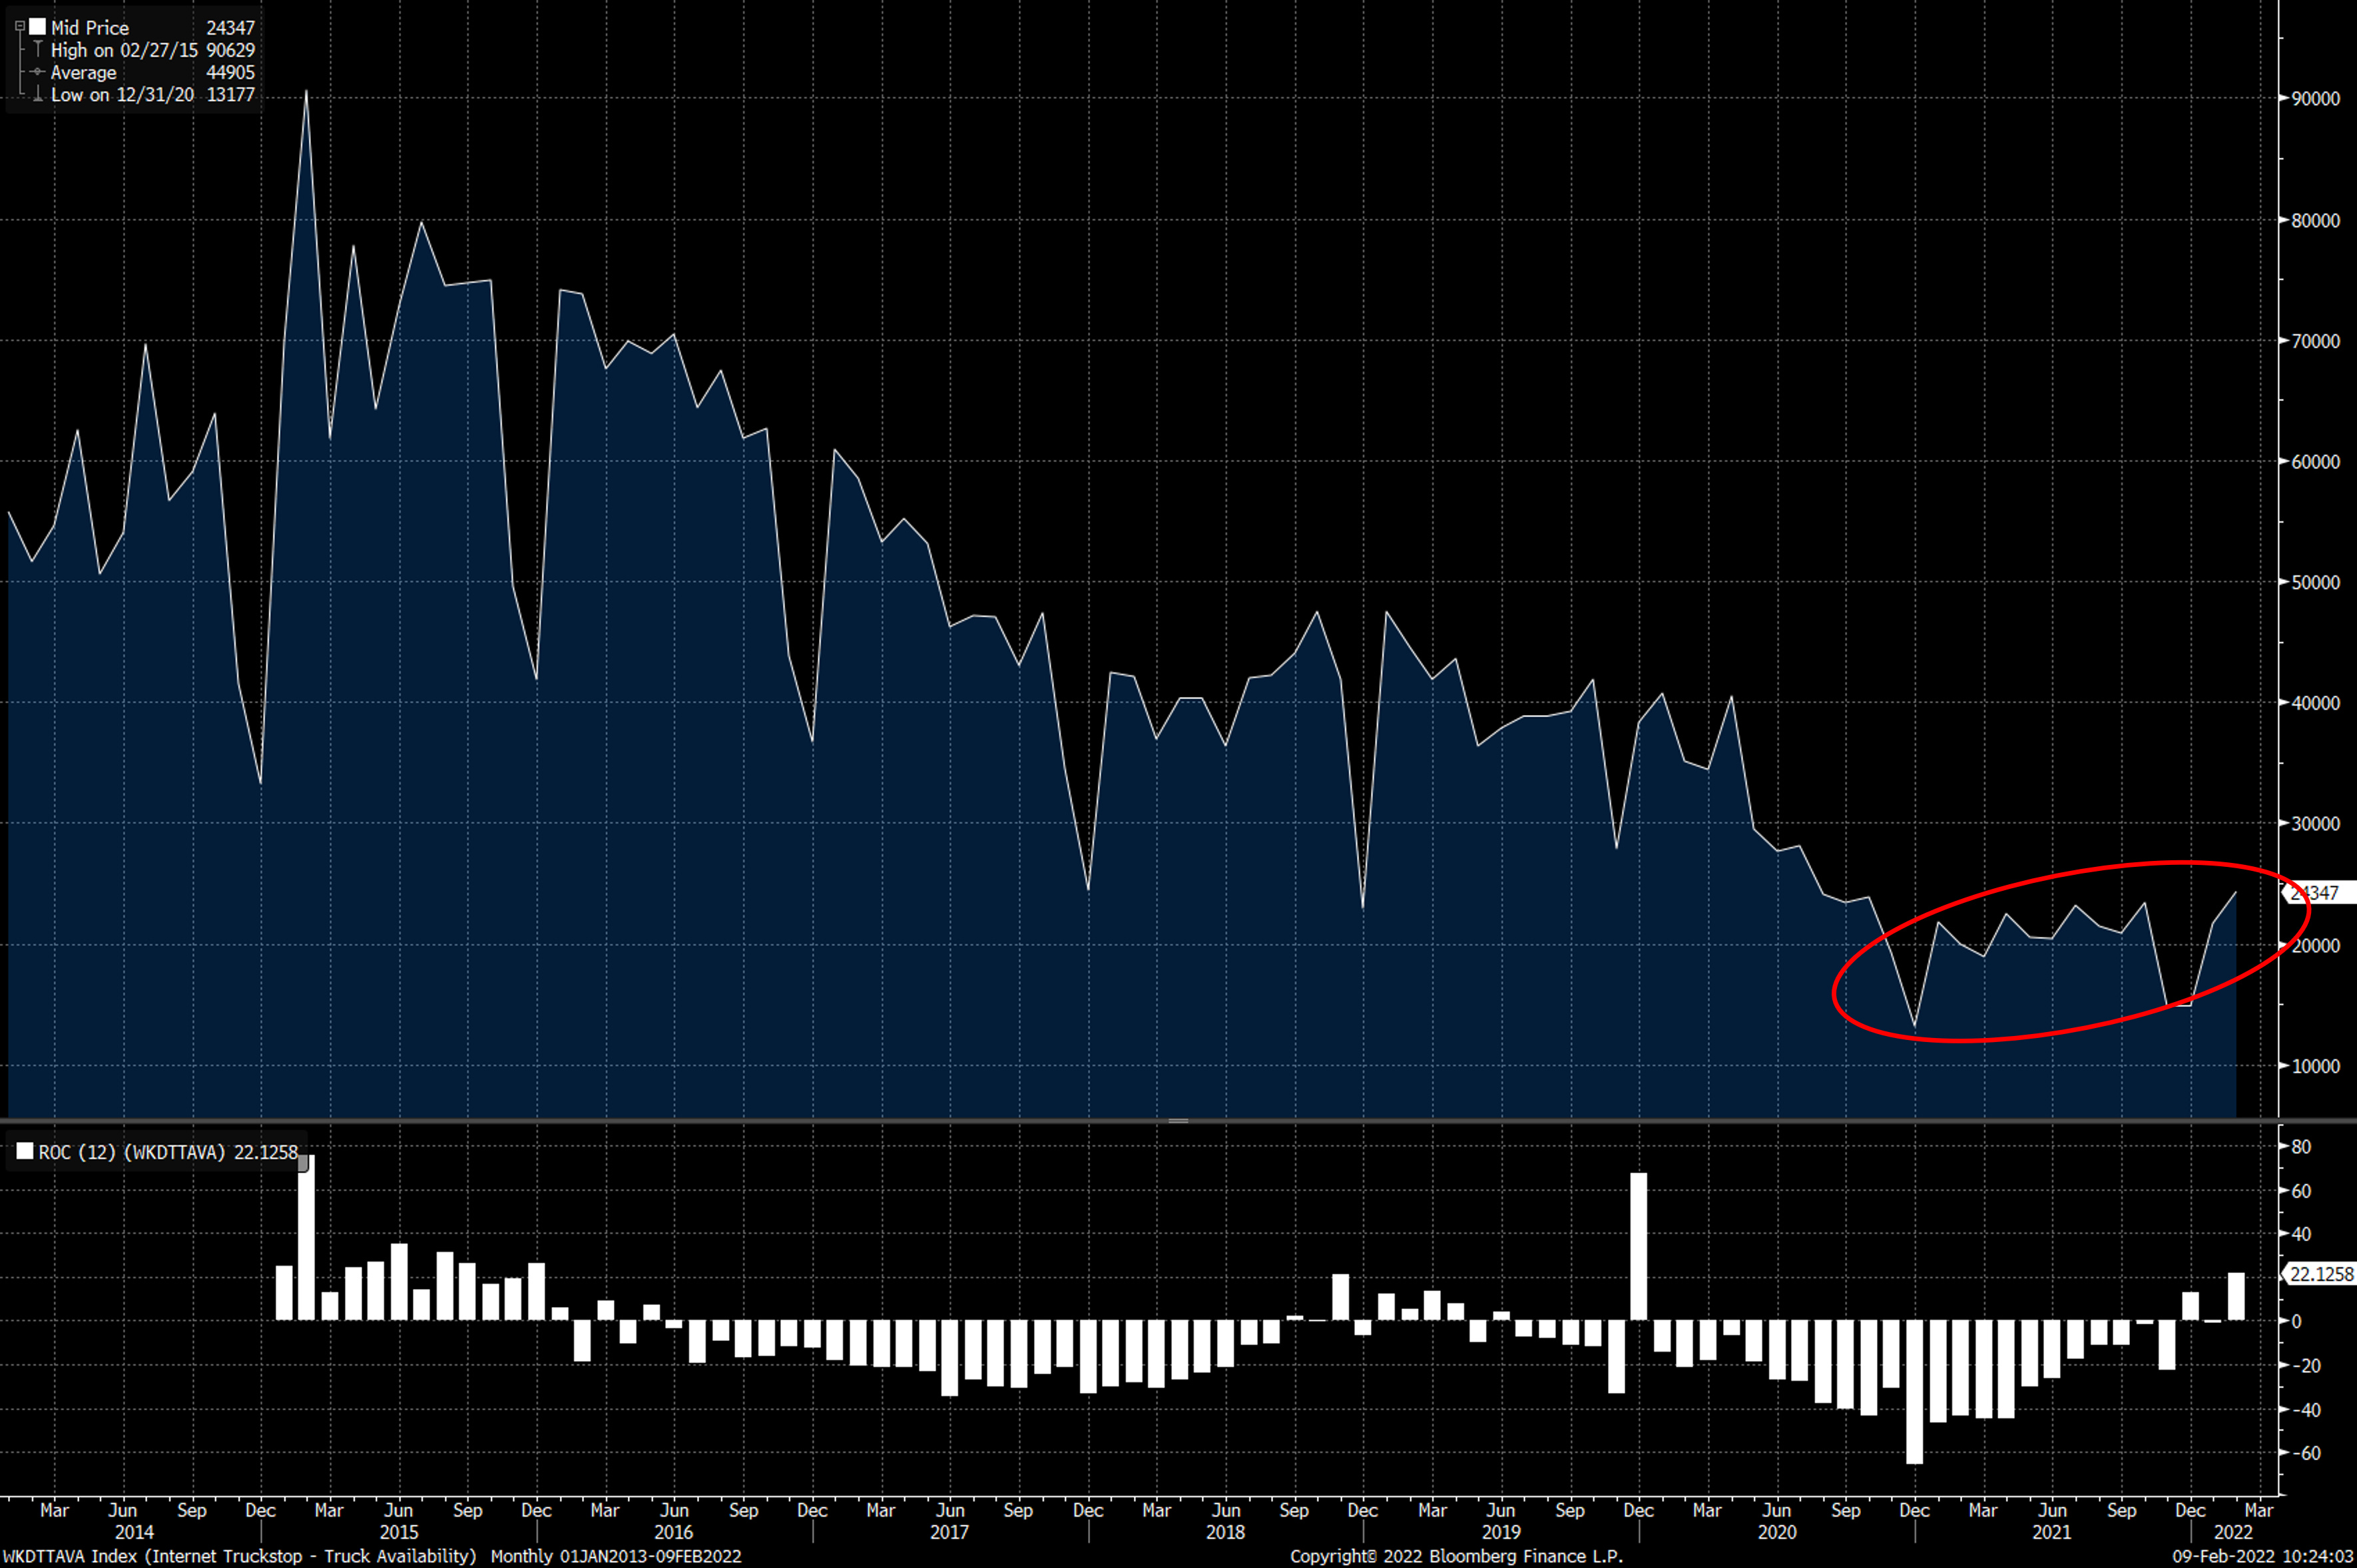
Starting with trucking availability. The significant decline in availability was in part due to truck loadings rebounding to all-time highs with ecommerce rocketing higher during the pandemic (called out in Part 1), and more recently due to constraints created by the omicron variant. Both of these factors are weakening going forward, and will likely provide increased availability for the oil and gas industry.
The next part is the rapid increase in truck wages. Trucking wages peaked in 4Q21’ and have come down slightly. The increase was due to the significant jump in demand, combined with labor shortages. With the labor pool expanding, there is a rising probability of wages peaking at worst, or falling at best.
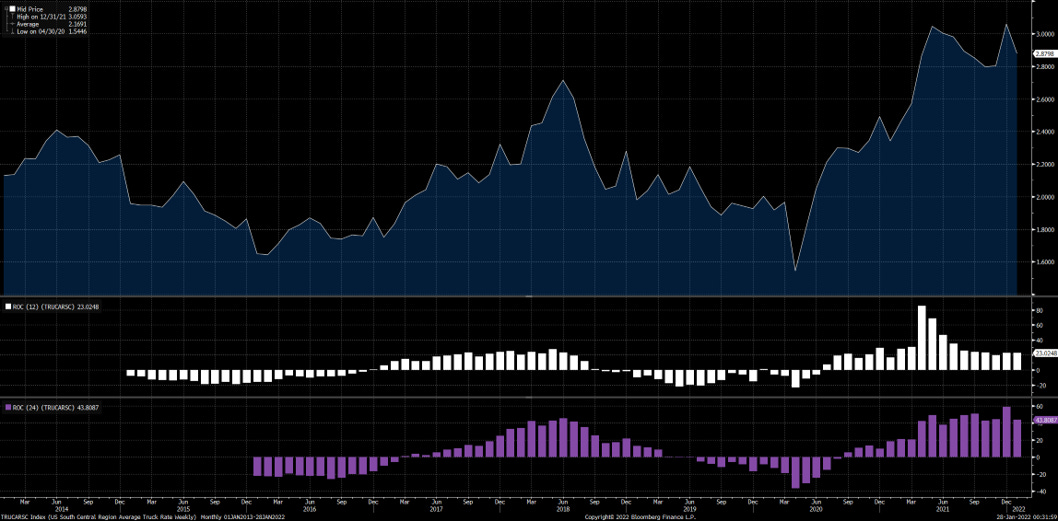
The flow through to truck rates is seen in the South Central (covers Permian basin) trucking rate index ($/mile). While this remains stubbornly high, increased trucking availability combined with more drivers will likely lead to a gradual reduction in rates. For Permian supply chains, this is a key figure to watch.
Activity Enemy #4: Sand
The last piece holding back operators is sand, and we are focused on the Permian. Sand is the cyclical commodity within the cyclical industry. From 2017 through 2019, ~60mm tons per year of in-basin capacity was built out in the Permian. When mine gate pricing dropped below opex costs (~$20/ton), mines shuddered capacity (part of 19’ and then again in 20’). Over the last 12 months, mine gate pricing has sky rocketed in the Permian to over $40/50 per ton. This is a far cry from companies basically giving away sand at the worst part of the downturn. At current prices, all Permian mines are economic, and likely running near full capacity. With the call for MOAR sand, mines are looking to expand operations. Expansion capacity is tricky, because lead times on equipment like dryers, centrifuges, etc. are lengthy with tight global supply chains (for now). As industrial supply chains loosen over 1H22’, lead times are likely to reduce and allow in-basin operations to meet in-basin demand. We have modeled effective capacity (in-basin supply below) increasing as idle capacity is brought back online, plant expansions occur and novel solutions are employed by operators.

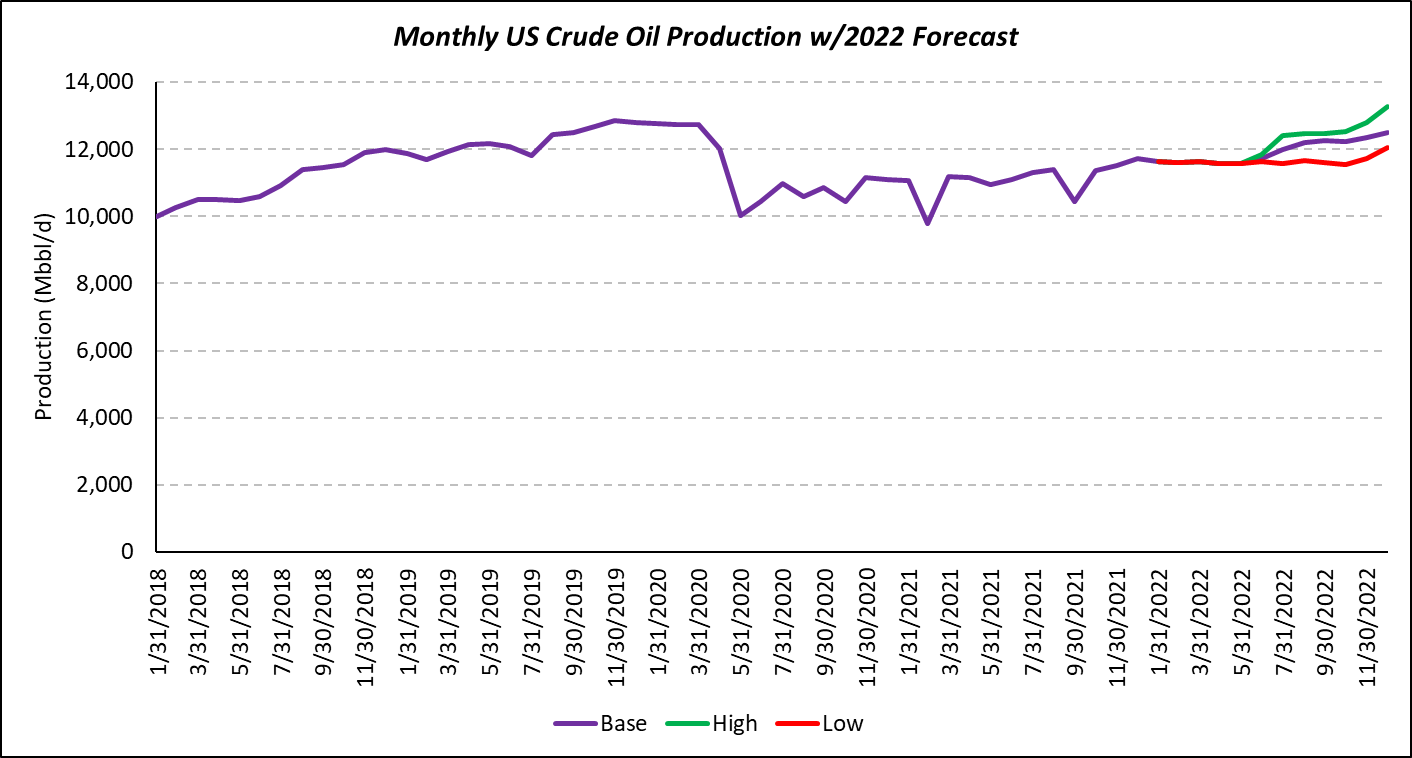
The key point for all of these supply chain problems is they are likely to persist in the oilfield through at least April and likely into mid/late 2Q22’. Once supply chains ease, operators will likely have an easier time ramping activity and in-turn growing production. At ~300 frac crews the U.S. is likely to grow production at ~2-3%/year (~250mbbl/d to 350mbbl/d). We are not stopping at 300 frac crews, and we have modeled the U.S. going to ~350 crews by July 22’. Based on our completion forecast, we expect the U.S. to exit at ~12.5mmbbl/d of crude production. There is a timing mismatch of barrels coming online this year vs. the cadence of demand growth. We need those barrels, and we need them now!
The next post in the series (and last) will focus on the international dynamics and crude balances. Will OPEC+ barrels ease the tightness in the market? Will escalations in Ukraine lead to barrels coming offline? Will China demand soften?
If you found this analysis helpful, please like the article, leave a comment and forward to your colleagues (or anyone interested in the energy markets)!
Disclaimer: This is not investment advice. All of the views are my own, and not representative of Donovan Ventures, LLC or Energy Founders Fund, L.P.
Great, thanks! Part 3 coming out soon ?
These are fantastic, thank you for these!