
Process. Status check on oil
Process. Status check on oil
Fundamentals remain constructive, while market signals waver.

Fundamentals first
Over the long-term (12 +months), fundamentals typically drive the direction of commodity markets. This is why I start with a fundamental base, and then overlay market and equity analysis to drive shorter-term positioning (<12 months). I am not going to dive into the granular aspects of each supply/demand component in this note, but rather highlight the key drivers from both a fundamental and market perspective shaping the outlook through year-end, and then an early look through to 2022.
Storage building, but continuing to decelerate vs. 2YR comps
The seasonal build in storage has been muted relative to historical cycles. Typically, storage builds during shoulder season as refineries commence turn-around operations. Over the last 30 years, the average 3-month change in storage in early November (~week 45) is ~1.5mmbbl. This figure varies and is heavily dependent on the broader supply/demand dynamics.
Below is a look at seasonal storage, as measured by the rolling 3-month change in storage. I highlighted 2017 and 2021, due to similarities between the cycles. The biggest difference in this cycle is the limited supply acceleration.
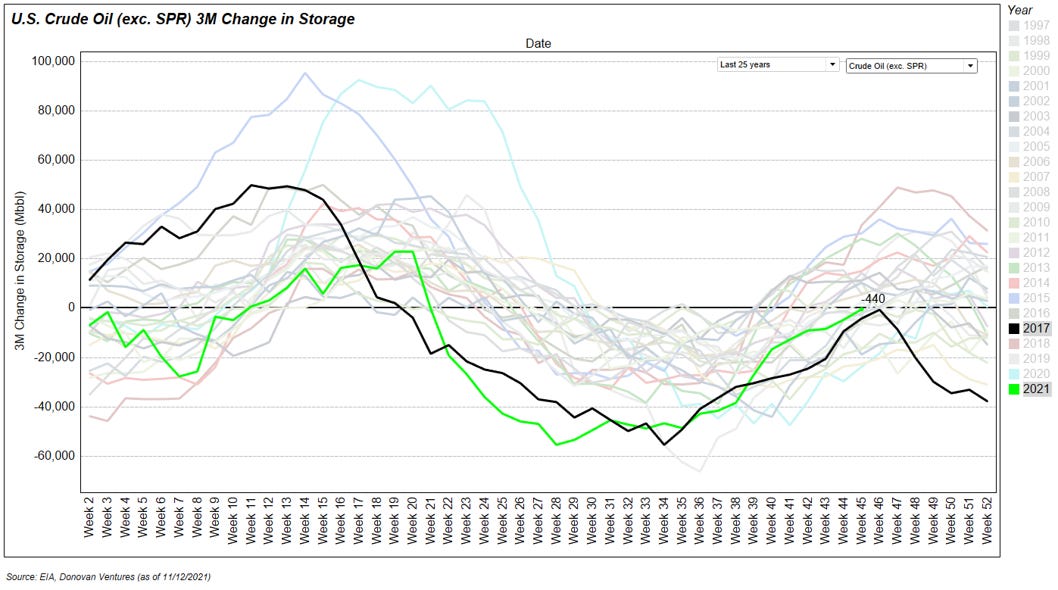
Coming out of the 2015/2016 downturn, storage was elevated after the price war with OPEC in late 2014. Limited supply acceleration, combined with accelerating demand (domestically, and more importantly abroad via exports) drove significant storage deceleration.
Storage deceleration is key to price acceleration, and during the 2017 cycle storage decelerated to just shy of -20% vs. the 2YR comparable period. Currently, storage has re-decelerated to -2.6% vs. the 2YR comparable period and is down ~11% Y/Y.

Over the last 30 years, decelerating storage (US crude oil ex. SPR) has driven accelerating price ~71% of reported months. Predicting price is incredibly difficult, but getting the rate of change right is much more doable.
Where is storage going?
Storage is firmly negative Y/Y, but the main question to ask is “where is storage going?”. Markets trade off future expectations, and commodities are no different. Taking a very high level look at the supply/demand balance, and implied impact to storage over the next few months. There are nuances in both supply and demand, so for now I am taking a 30,000’ view. Using EIA data, the below is a snapshot of the weekly supply/demand balance. For supply I am using US field production, crude imports and unaccounted for oil. Quick side note on unaccounted for oil, this is typically the plug from the EIA based on the weekly change in storage. If the number is positive, there is additional oil that was not factored in field production or imports. Conversely, if it is negative there was an implied excess in demand that was not captured in exports or refiner net inputs. It is an incredibly noisy value, but necessary to include for total balances.
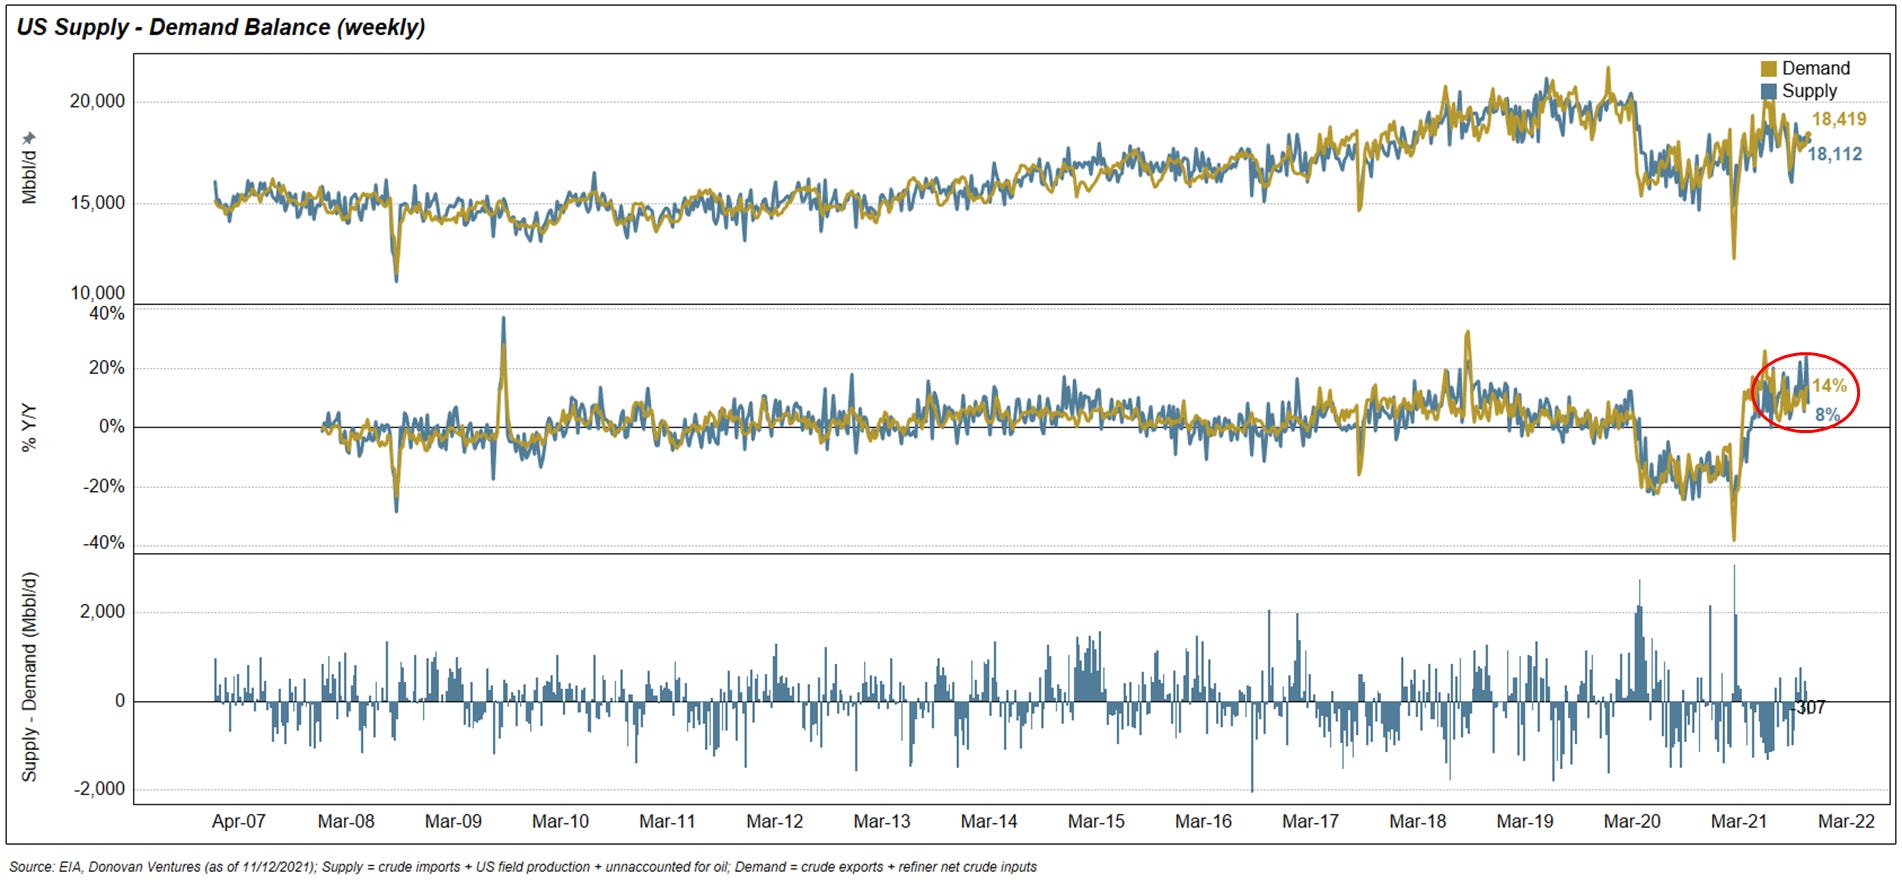
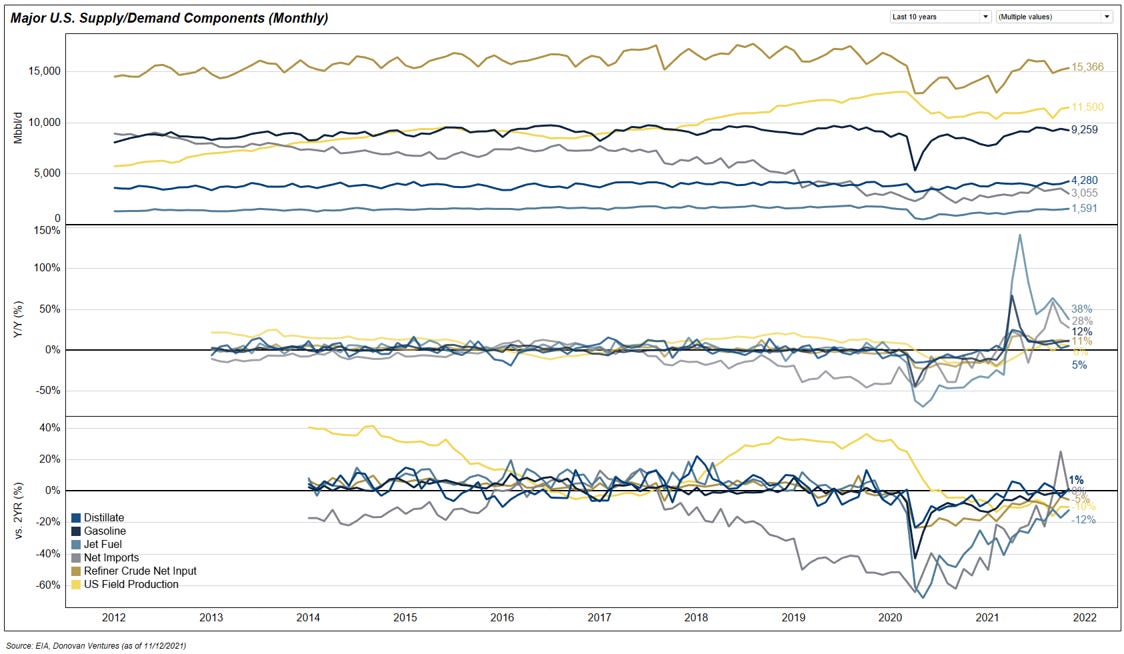
Total demand (crude exports + refiner crude net inputs) currently sits at ~18.4mmbbl/d vs. supply of ~18.1mmbbl/d (crude imports + us field production + unaccounted for oil). Throughout summer, the supply deficit averaged ~0.6mmbbl/d (from May through 1st week of September). That deficit has narrowed to ~0.1mmbbl/d (2nd week of September through current). The seasonal lull in demand is a primary factor, but we have also seen a slight acceleration in US field production. The pace of acceleration of each of these components is key. Total demand is +14% Y/Y, while supply is lagging at +8% Y/Y. Jet fuel, the main demand laggard, has accelerated to -12% vs. the 2YR comparable period, and is +38% Y/Y. Gasoline demand remains robust and is back to pre-Covid levels at +1% vs. 2019. Distillates weakened into fall, but remain +1% vs. 2019.
Breaking out this last piece, because the dynamics surrounding imports/exports are concerning. Since the low point in September 2020, imports have risen +929 Mbbl/d to ~6.1mmbbl/d. At the same time, exports are effectively flat with only a +35 Mbbl/d increase to ~3.1mmbbl/d.
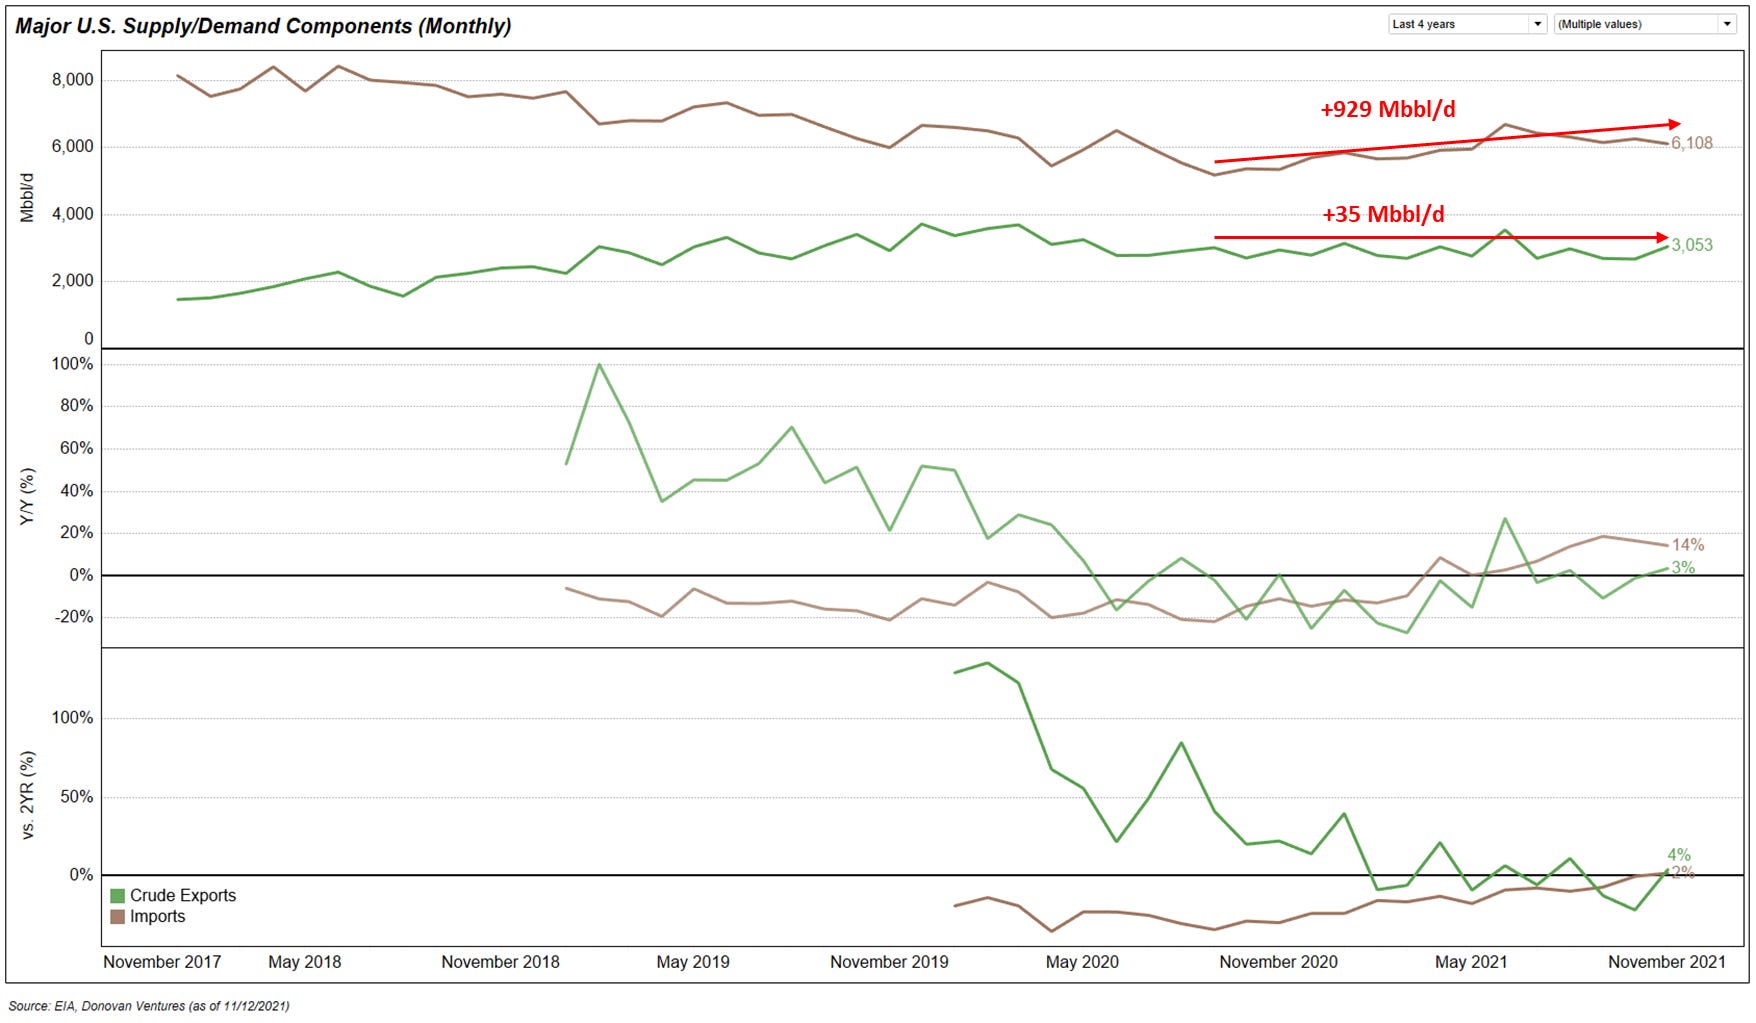
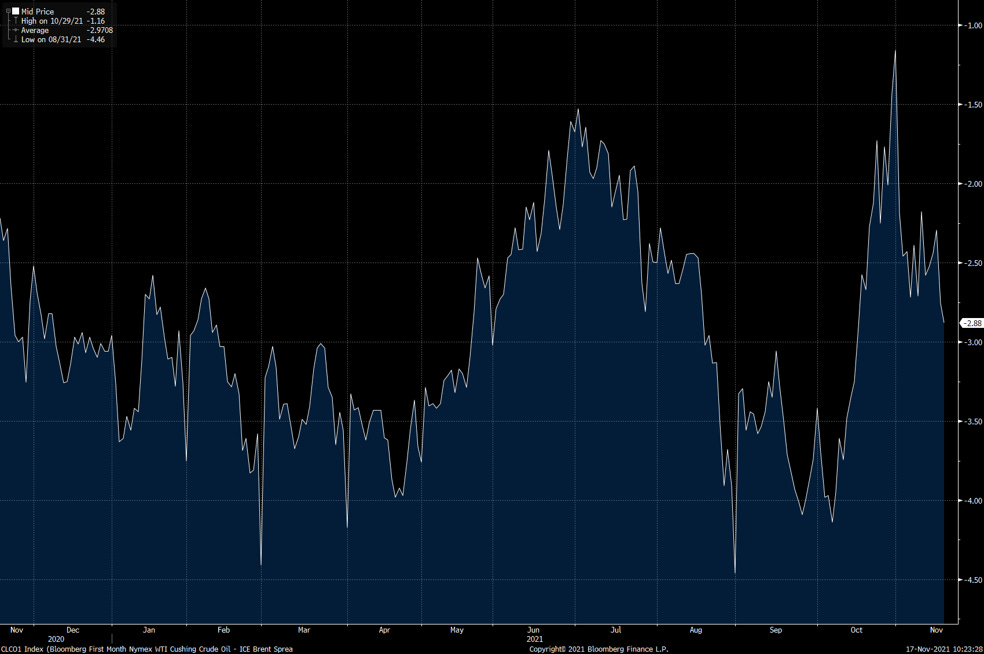
A primary driver of export growth is the Brent/WTI spread. I have posted on this before, but a key number here to drive accelerating exports is -$3/bbl differential vs. Brent. There is roughly a 3 month lag between the Brent/WTI spread and export rate of change. After a brief period <$3/bbl in late August through early October, the spread compressed all the way back to ~$1/bbl. More recently, relative strength in Brent has driven the spread back to ~$2.88/bbl. One additional mechanism here that will play out during the winter is gas to oil switching. The estimates to demand vary widely, but for simplicity I expect this dynamic to support a floor in U.S. crude exports this winter.
Limited supply acceleration, combined with upside in export growth and accelerating demand into year-end, is likely to drive continued crude storage (ex. SPR) deceleration vs. the 2YR comparable period and re-deceleration Y/Y.
Passing the baton to the markets
Volatility rules
The fundamental picture remains constructive, but what about the market? The first, and most important piece, is volatility. Cross-asset class volatility is a key driver of fund flows, and often shoots the first warning shots before drawdowns. Since March 2020, volatility has seen small bouts of non-trending volatility spikes. Those bouts of volatility spikes have represented buyable dips in equities and commodities. For this analysis, I am going to focus mainly on factors impacting commodities and associated energy equities.

Above is a screen I track on a daily basis to understand where volatility is trending for each asset class. Quickly highlighting each of these components: 1) VIX - S&P500 volatility, 2) VXN - Nasdaq volatility, 3) RVX - Russell 2000 volatility, 4) CVIX - currency volatility 5), MOVE - bond volatility and 6) OVX - crude oil (WTI) volatility. Volatility across asset classes are typically positively correlated. The table below is a summary of the percent of trading days where the MOVE index has a positive correlation to the various volatility indices. The sample set is across 10 years of trading data.

The recent breakout in bond volatility (and current volatility) is a warning shot to broader risk assets (equities and commodities). I am not forecasting volatility levels, only observing there is a rising probability equity and commodity volatility will increase if bond/current volatility remains elevated.
Bond (not James)
Expanding further on the relationship between bond volatility, bond yields (10YR in this case) and commodities. When bond volatility moves to elevated levels, forward moves lower in the 10YR yield become more likely. The below chart summarizes the forward change (in basis points for 10YR yield) at various MOVE levels. At 81 (current MOVE level), short duration (<30D) moves in the 10YR yield are slightly more likely to be negative. For medium-term moves (90D), there is a higher probability of moves lower in the 10YR yield on a forward basis. Environments where the MOVE remains depressed (<60), yields have the tendency to rise on a forward basis.

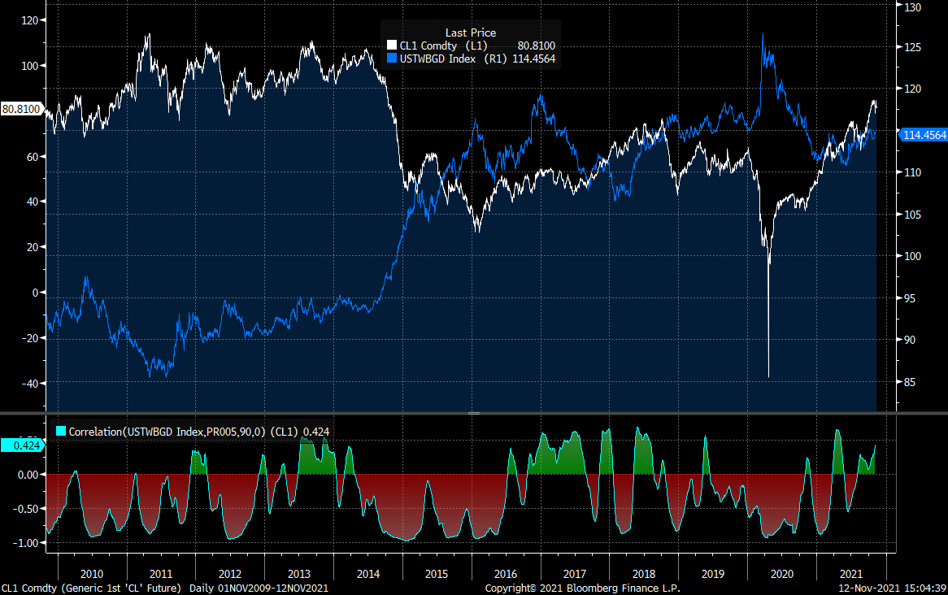
A forward move lower in the 10YR yield would likely provide downward pressure on WTI. Below I plotted the 10YR yield vs. WTI over the last 10 years. Over that history, the 10YR and WTI have shown a positive correlation for ~72% of trading days.

The next piece is fairly intuitive, but is nuanced when adding the element of correlations between the 10YR yield and WTI. When the 10YR yield has a negative forward 90D return (ie. lower yields) and the trailing 90D correlation between the 10YR and WTI is positive, the average forward 90D return for WTI is -5.2% with a 40% positive ratio. In the same scenario, but with a negative trailing correlation, the average forward 90D WTI return is slightly higher at -4.7% and a 42% positive ratio. Various scenarios are shown below.

Summarizing above. When the 10YR yield is falling, there is a greater probability for WTI to fall as well. In scenarios where there is a negative correlation (only ~38% of trading days over the last 10 years), the expected return is slightly higher than when the correlation is positive. While the 10YR yield has not started to fall, there is a rising probability of lower yields if the MOVE index remains in the 75 to 90 level. For now, this is a mild warning sign for crude.
King dollar
Slightly shorter section here, but important given recent moves in the currency markets. Typically, the trade weighted dollar and WTI are inversely correlated (~71% of trading days over last 10 years). The recent move higher in the dollar is the second warning sign when looking across asset classes. Since mid-June, the trade weighted dollar has rallied ~2.7% to a 2H21’ high of 114.9.
Historically, when WTI has a positive correlation with the trade weighted dollar (like now), forward returns tend to be positive. Over the last 10 years, when the trade weighted dollar has a positive forward return and the trailing 90D correlation with WTI is positive, the average forward 90D return for WTI is ~0.4% with a positive ratio of ~58.3%. While this is currently a constructive setup for forward WTI returns, I am watching this relationship very closely. Historically, positive correlations to the dollar last an average of 55 trading days (we are currently at 72 trading days with a positive correlation). A rising dollar and falling correlation to WTI would present a significant headwind for higher WTI prices. Red lights are not flashing, but this is certainly a warning sign.

Rounding out with equity vol
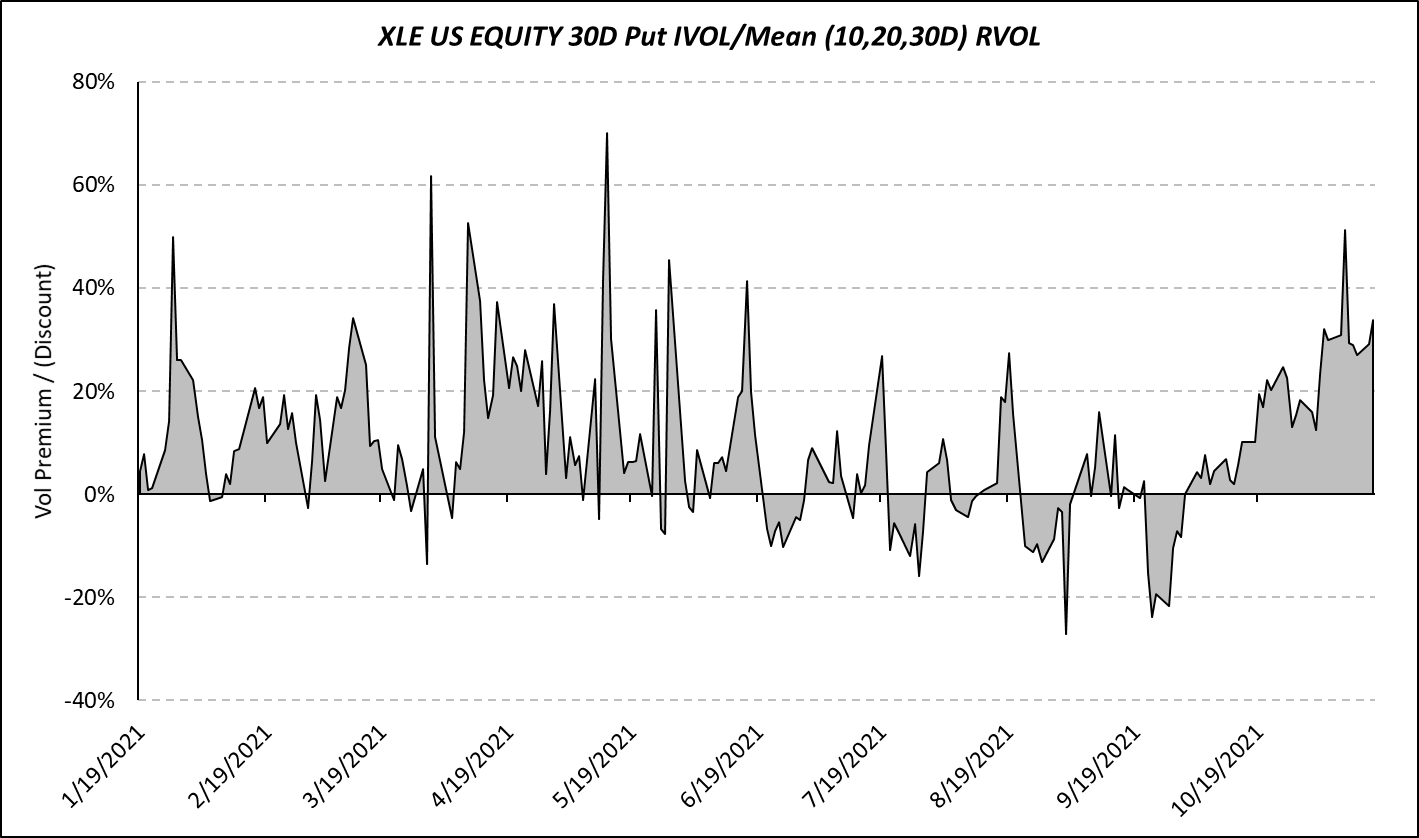
Everything so far has revolved around index vol, 10YR yields, and currencies. The last piece I want to highlight is volatility related to energy equities. Below I look at the implied vol premium for XLE. Implied vol premium is defined as 30D put implied volatility divided by the mean realized volatility over a 10,20 and 30D duration. XLE is typically used as the benchmark for energy equity performance. The current implied vol premium of 34% represents a 1.45x 3-year Z-score and as shown in the chart below, volatility has remained elevated since early October. Typically, when a significant implied volatility premium develops, it often indicates elevated buying of downside protection via puts. The current implied volatility premium makes a significant downside move a little less likely, and is a mild tailwind for equity prices.
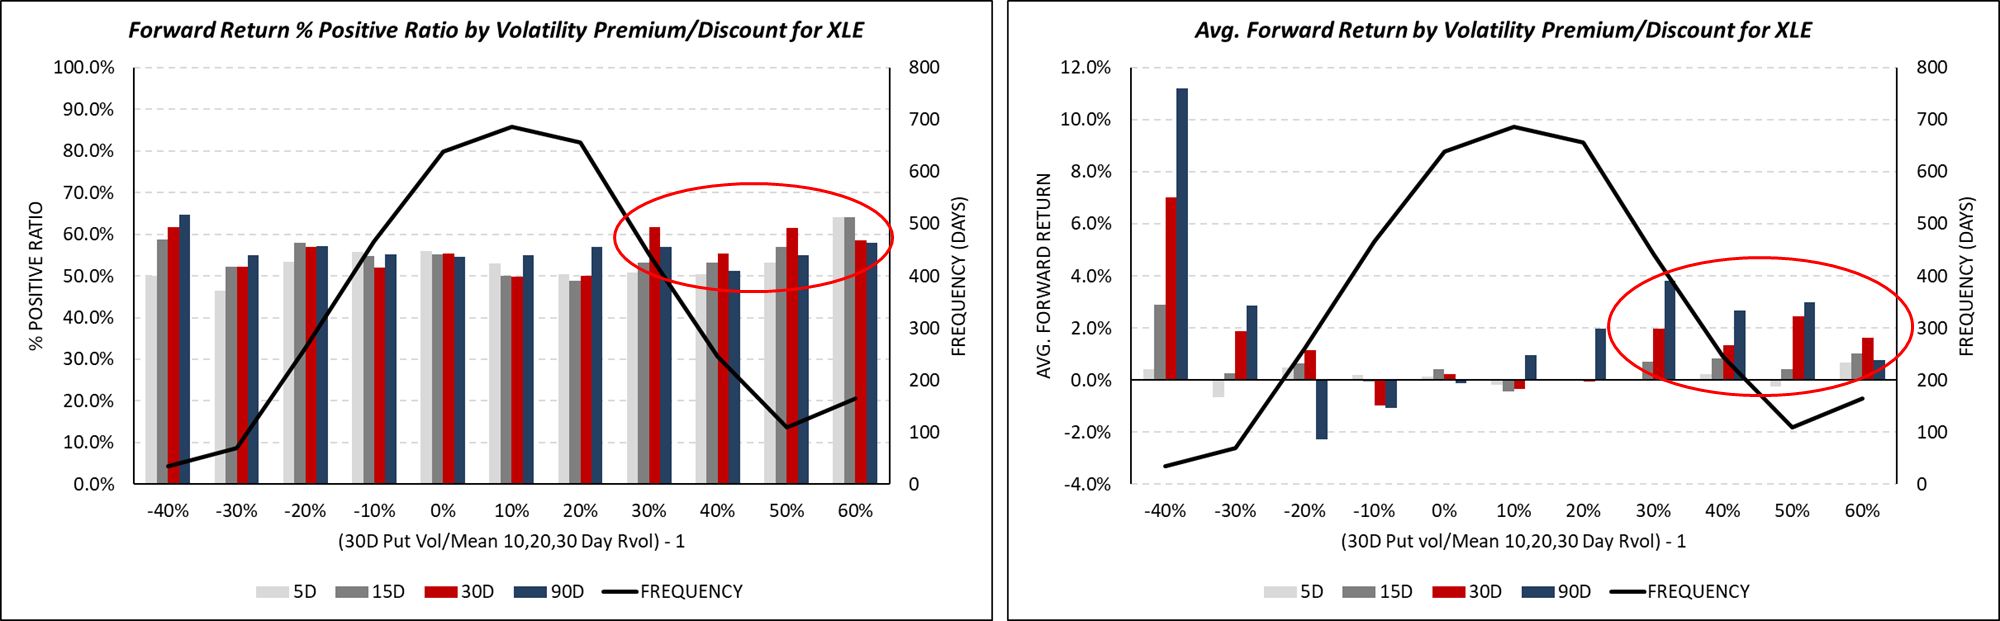
Below is a summary of the forward return profile of XLE at various levels of implied volatility premiums/discounts.
Where to go now?
The near-term setup for WTI and energy equities is not nearly as easy as it was earlier this year (duh). However, significant upside remains in WTI as storage continues to decelerate through year-end (and likely through 1Q22’). Increasing volatility in the market will likely provide opportunities to add net length to positions with oil beta. Spikes in volatility are likely to drive 10-20%+ corrections in energy equities, but the path over the next 6 months is much higher. My portfolio is neutral natural gas weighed equities, and slightly net long oil weighted equities. I have a long-bias to lower leverage, larger cap oil weighted equities (and a few service companies). I will highlight a few of these names in the coming weeks.
If you found this analysis helpful, please feel free to forward to your colleagues and anyone interested in the energy markets!
Disclaimer: This is not investment advice. All of the views are my own, and not representative of Donovan Ventures, LLC or Energy Founders Fund, L.P.