
Momentum - friend or foe?
Momentum - friend or foe?
Positive demand momentum critical for oil and energy equities into 4Q

Quick flashback to the Summer that was
Summer 2021 was everything we expected in terms of crude oil demand acceleration, with some serious momentum going into the summer that drove a tightening crude market. Momentum on the demand side was a primary driver for equities and commodity prices. XLE (blue line, broad ETF tracking energy equities) reached a YTD closing high of $56.19 on June 15th, and then WTI (white line) hit a YTD closing high of $75.25 on July 13th.

Those following my process on Twitter were well positioned for a run in energy equities. In May I posted a thread highlighting the market was still not bullish enough on crude oil and related equities. In that thread I pointed to demand accelerating to >16Mmbl/d by August. In this case, I define demand as refiner net crude inputs, reported by the EIA in their weekly crude status report. Flash forward to the end of summer driving season. We saw demand hold >16 Mmbbl/d for the majority of summer (June 11th through July 16th, and then again for first three weeks of August). For existing subscribers, you will be familiar with the below. For new subscribers, I will go into a bit of detail.
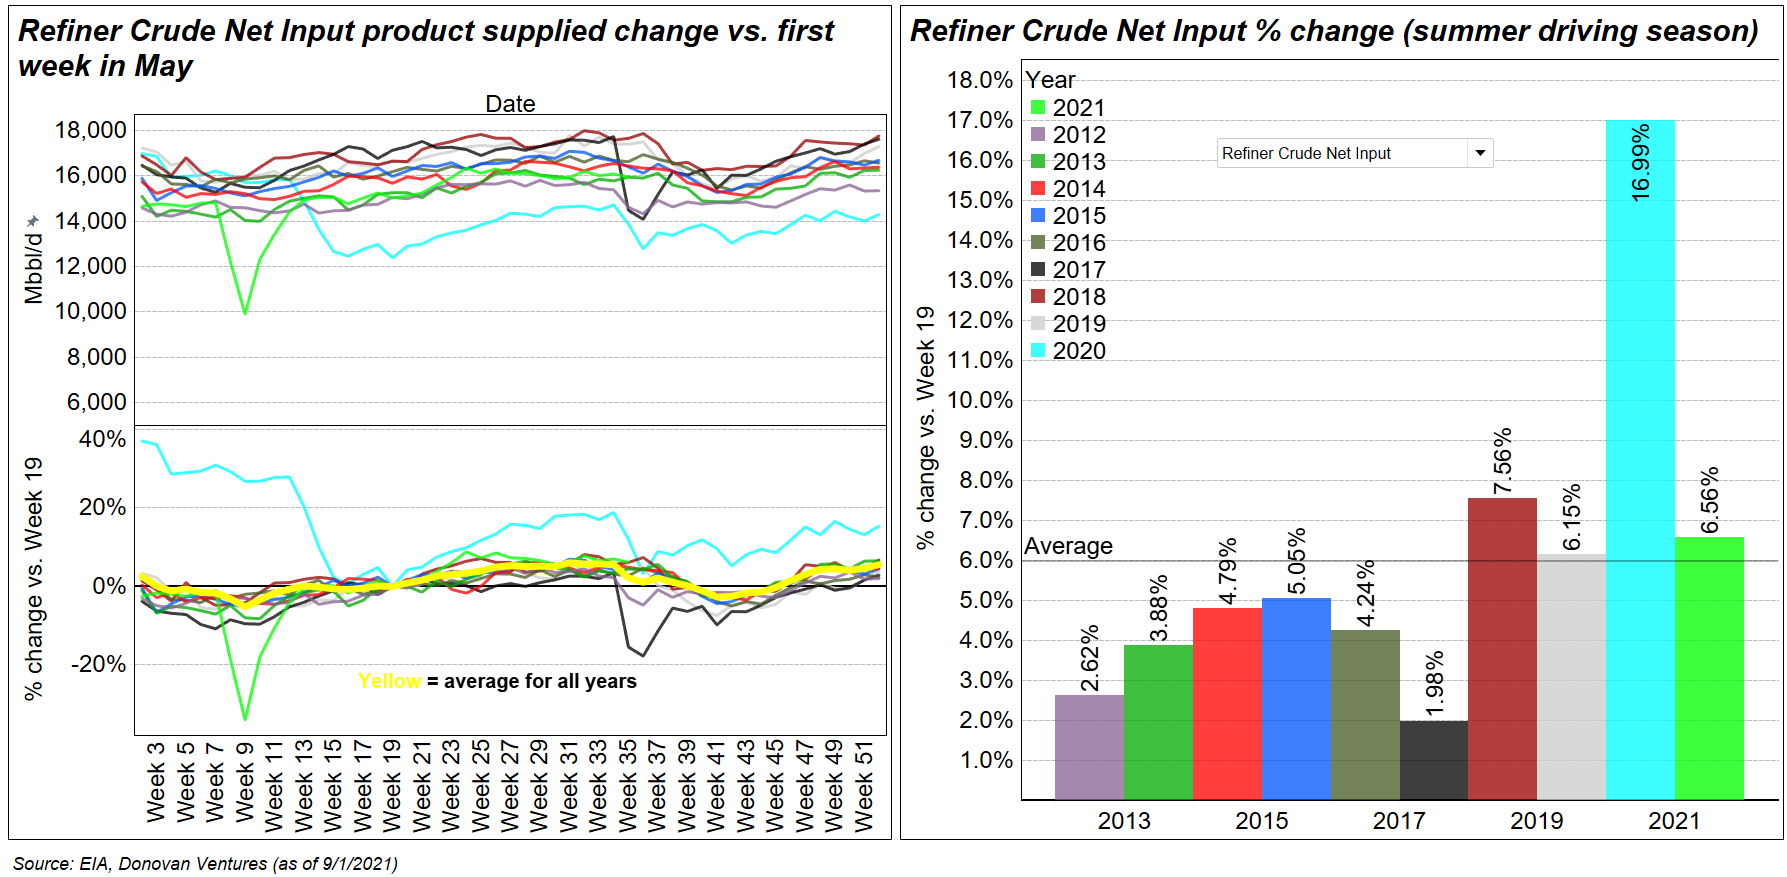
The top left panel is weekly refiner net crude input (Mbbl/d) for the U.S., colored by year. This is widely known as a “seasonality” chart, and people with Bloomberg subscriptions will be very familiar with this format. The bottom left panel is the % change in refiner net crude input vs. week 19, on a rolling basis (effectively each week’s level relative to week 19). Week 19 marks the start of summer driving season and is typically the first or second week of May. The right panel is an annual look at the % change in refiner net crude input from week 19 to week 33. Week 33 is typically the second or third week in August, and marks the peak in summer driving season domestically (from a crude refining perspective). 2020 was a major outlier because the start of summer driving season was while the majority of states were still locked down due to Covid-19 (low base of ~12.3 Mmbbl/d). Looking forward to 2021, it was apparent there was significant pent up demand, and we would likely see above trend demand acceleration for the summer. That is exactly what happened, and demand accelerated to +6.56% vs. week 19.
Where to now?
Commodity markets typically discount where the fundamental balance is likely to go, and that is one of the biggest questions over the next 3 to 4 months. While demand accelerated from -25.6% to -5.4% from May 2020 to July 2021 (vs. 2YR comparable period), demand has recently decelerated to -8.3% (vs. 2YR comparable period) in latest reported data.
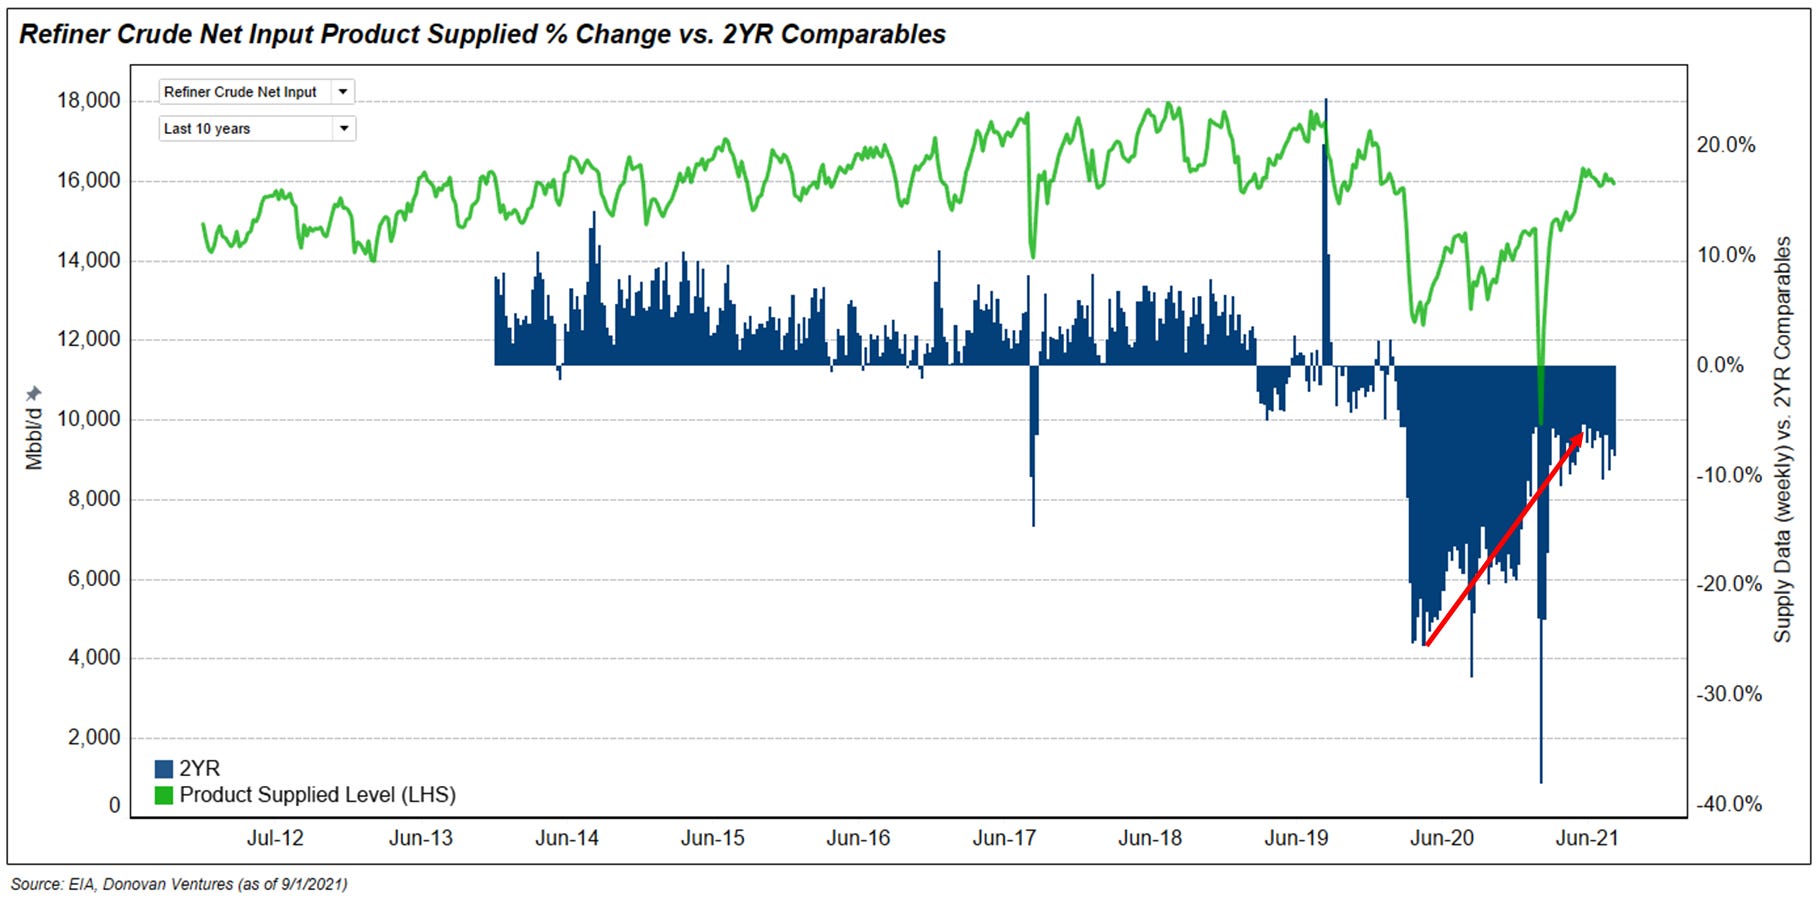
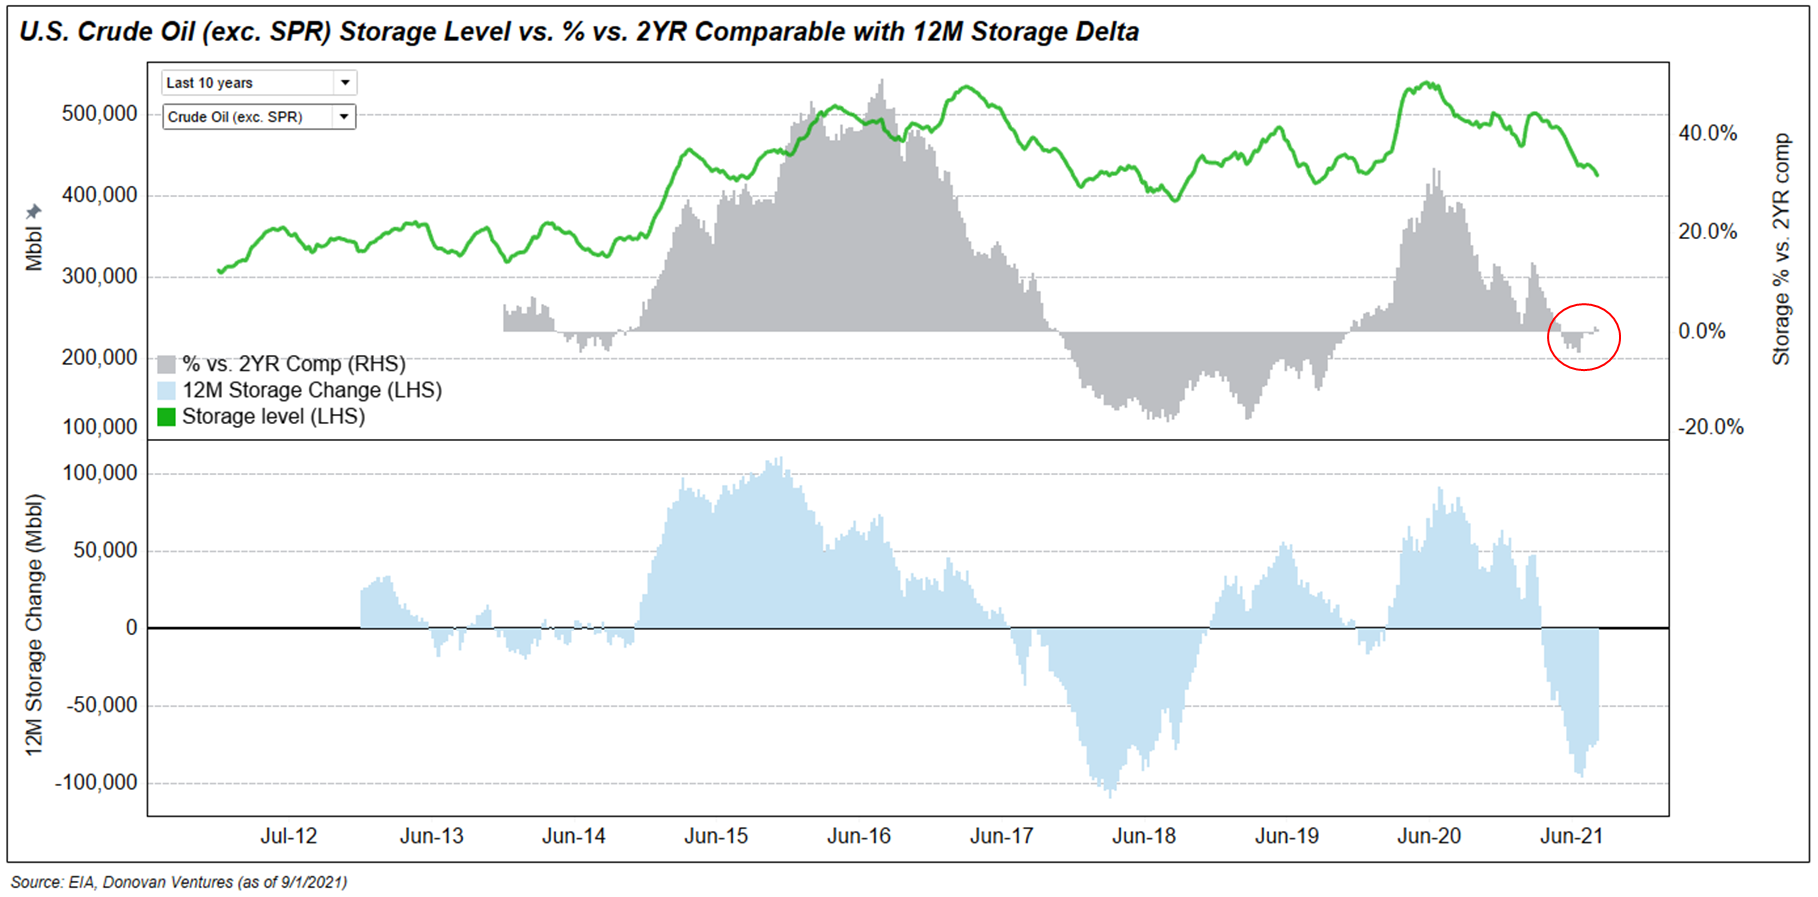
This in turn drove storage to re-accelerate relative to the 2YR comparable period from mid-July to August.
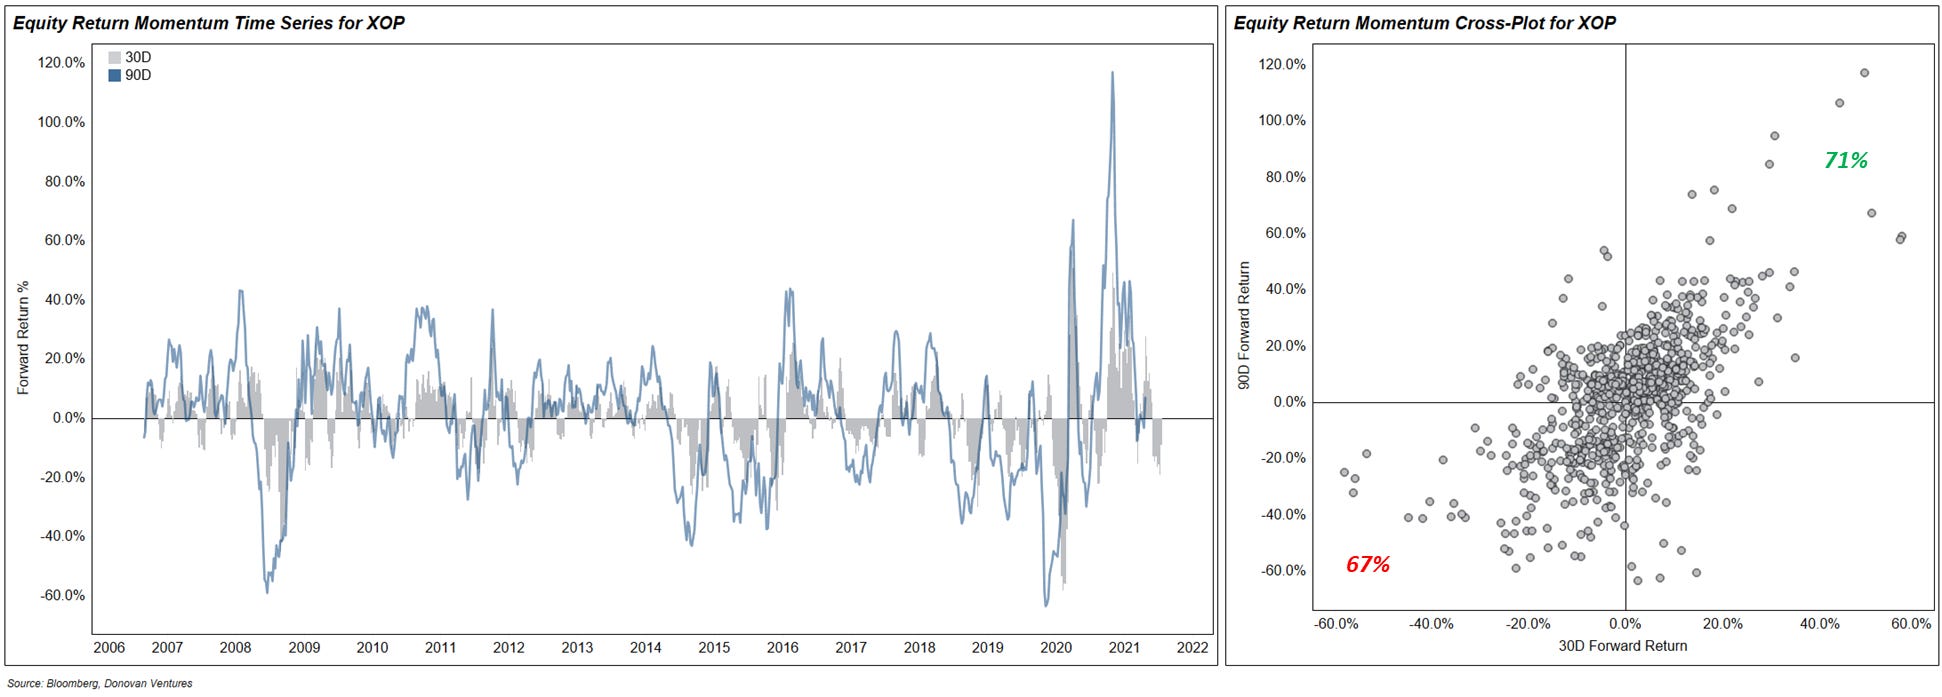
The re-acceleration in storage was a driving factor in the significant pull-back in crude oil price, and related energy equities. Below is a YTD price chart for the XOP ETF (oil and gas producers ETF). The middle panel is the rolling 30D % change, and the bottom panel is the rolling 90D % change. While storage was re-accelerating, the XOP had its largest 30D and 90D pull-back this year on August 20th at -22%/-8.5%, respectively. Storage is a piece of the puzzle from the fundamental side, but there are several market factors that contributed to this move. I will touch on those later this week (rates, dollar, volatility).
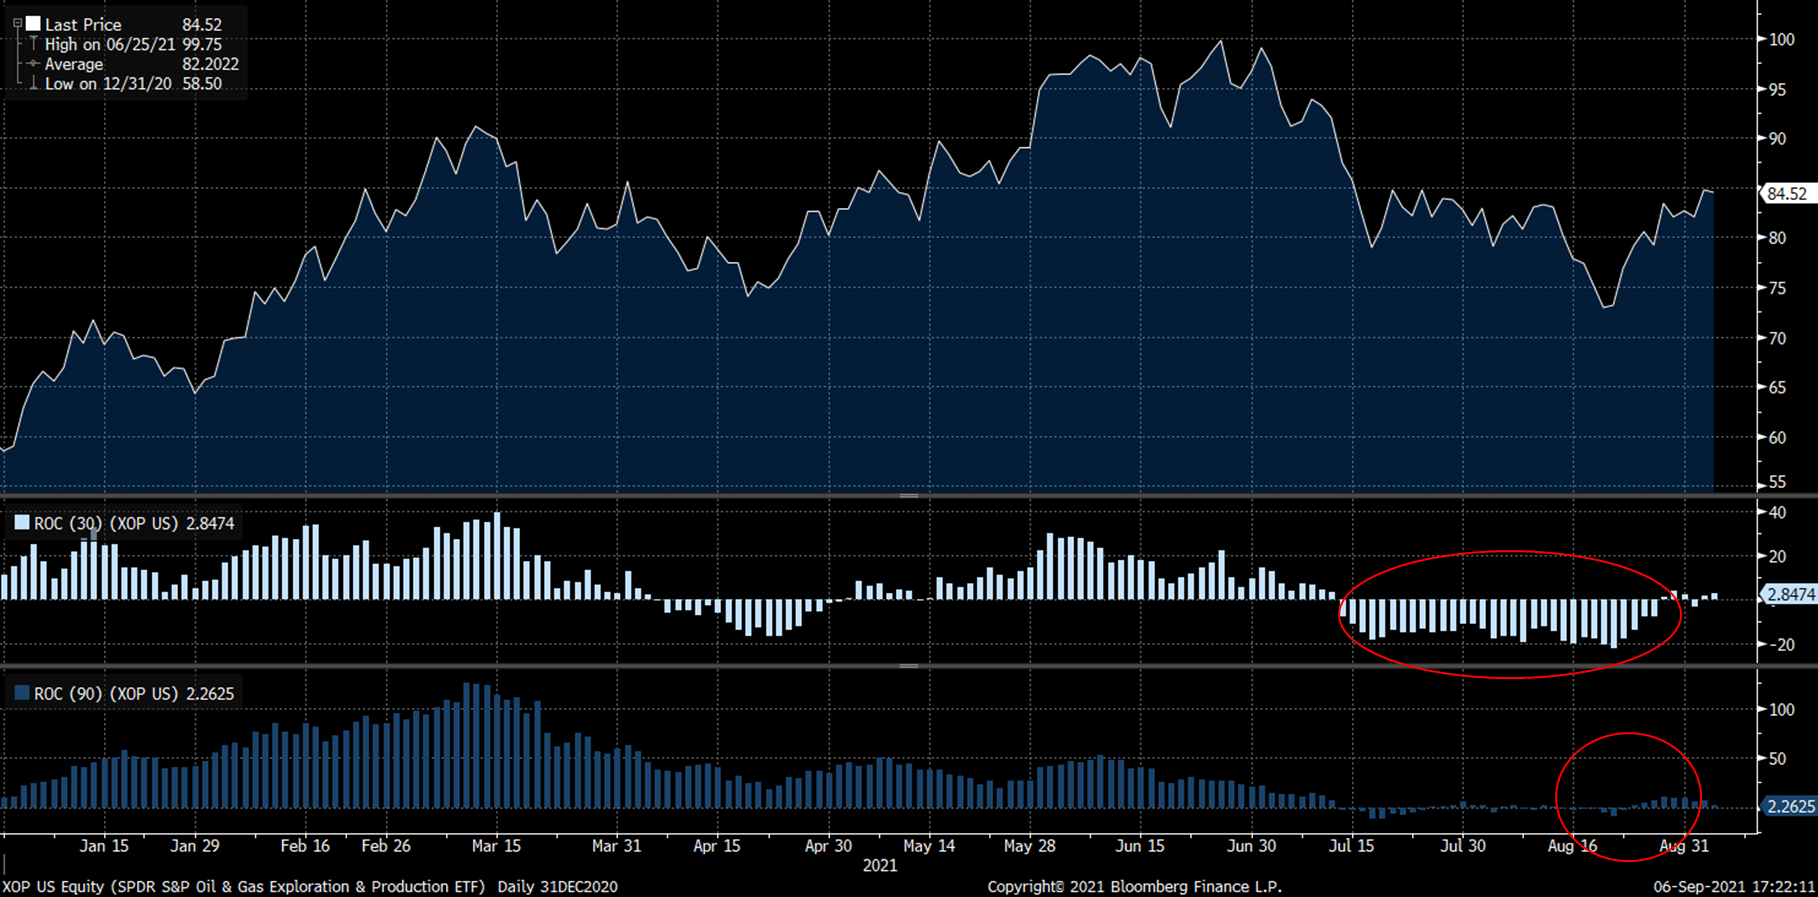
There are many algorithmic traders and quant firms which focus heavily on momentum as a style factor (more on these later in market analysis), and positive momentum on a 30D/90D basis is important. Below, I looked at the forward 30D returns vs. the forward 90D returns for XOP. The correlation is not strong (0.38 R2) over last 15 years, but the critical piece is the relative momentum. When the forward 30D XOP return is positive, the forward 90D XOP return is positive 71% of weeks reported since 2006 (first trading of XOP ETF). Conversely, when the 30D return is negative, the 90D returns is negative for 67% of the time. The 30D return (historical) for XOP is currently +2.8%.
On the fundamental side, a similar dynamic can be seen. Focusing on the right panel below, I looked at the relative rate of change for domestic crude storage (ex. SPR). The rate of change compared to the 2YR comparable period. On the X-axis, I plotted the 3 month delta of the rate of change (“relative change”) vs. the 2YR comparable period. On the Y-axis, I plotted the 6 month delta of the rate of change vs. the 2YR comparable period. The correlation is 0.53 R2 over the last 15 years, and 0.60 R2 over the last 10 years. The relative acceleration/deceleration is again the focal point. When the 3 month relative change is positive, the 6 month relative change is also positive ~80% of the weeks reported over the last 15 years. Conversely, when the 3 month relative rate of change is negative, the 6 month relative rate of change is negative 72% of weeks reported.
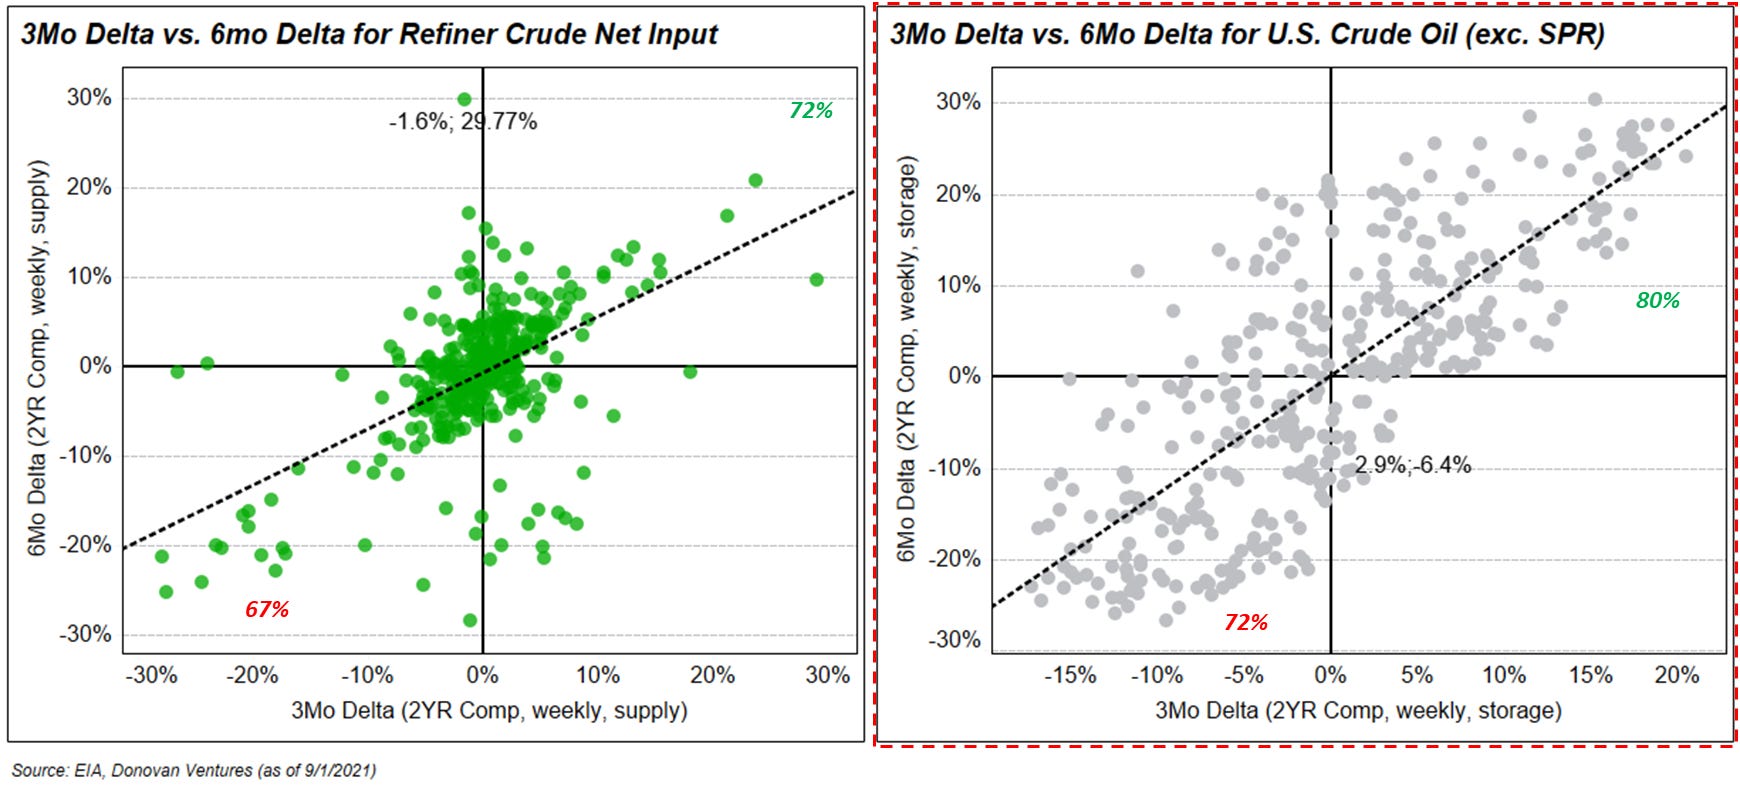
Currently the 3 month delta is +2.9% vs. the 6 month delta of -6.4%. Going forward, it is critical for the 3 month delta to re-decelerate into negative territory. Otherwise, the probability rises quickly for storage to continue accelerating on a longer 6 month duration. That is why demand momentum into the “shoulder” season is critical. While seasonal weakness is expected, the pace of that seasonal decline relative to 2020 and 2019 is the key point to watch. One of the high frequency data sets I watch closely is the Google Mobility Index. I am waiting for the Labor Day travel demand to be captured in the data set, and will provide an update once I receive that data (likely 9/8 to 9/10). That data will provide an initial look at the “exit velocity” of demand as we go into 4Q. If there is weakness in the demand rate of change, that will flow through to equities negatively. Conversely, if we see demand accelerate that will be a positive for equities.
One last comment I will make on the fundamental data. We are likely to see a fairly significant impact from Hurricane Ida to crude storage and implied refined product demand data over the next 2-3 weeks. It is a large positive that Gulf of Mexico crude production remains shut-in for several large producers (like Shell). ~1.6 Mmbbl/d is still shut-in across the Gulf. The data will be noisy, but the real issue has not been a supply side one to this point. Other real-time demand sources such as mobility will be good barometers of demand acceleration, while the fundamental data is noisy from the EIA.
Near-term probable WTI price range
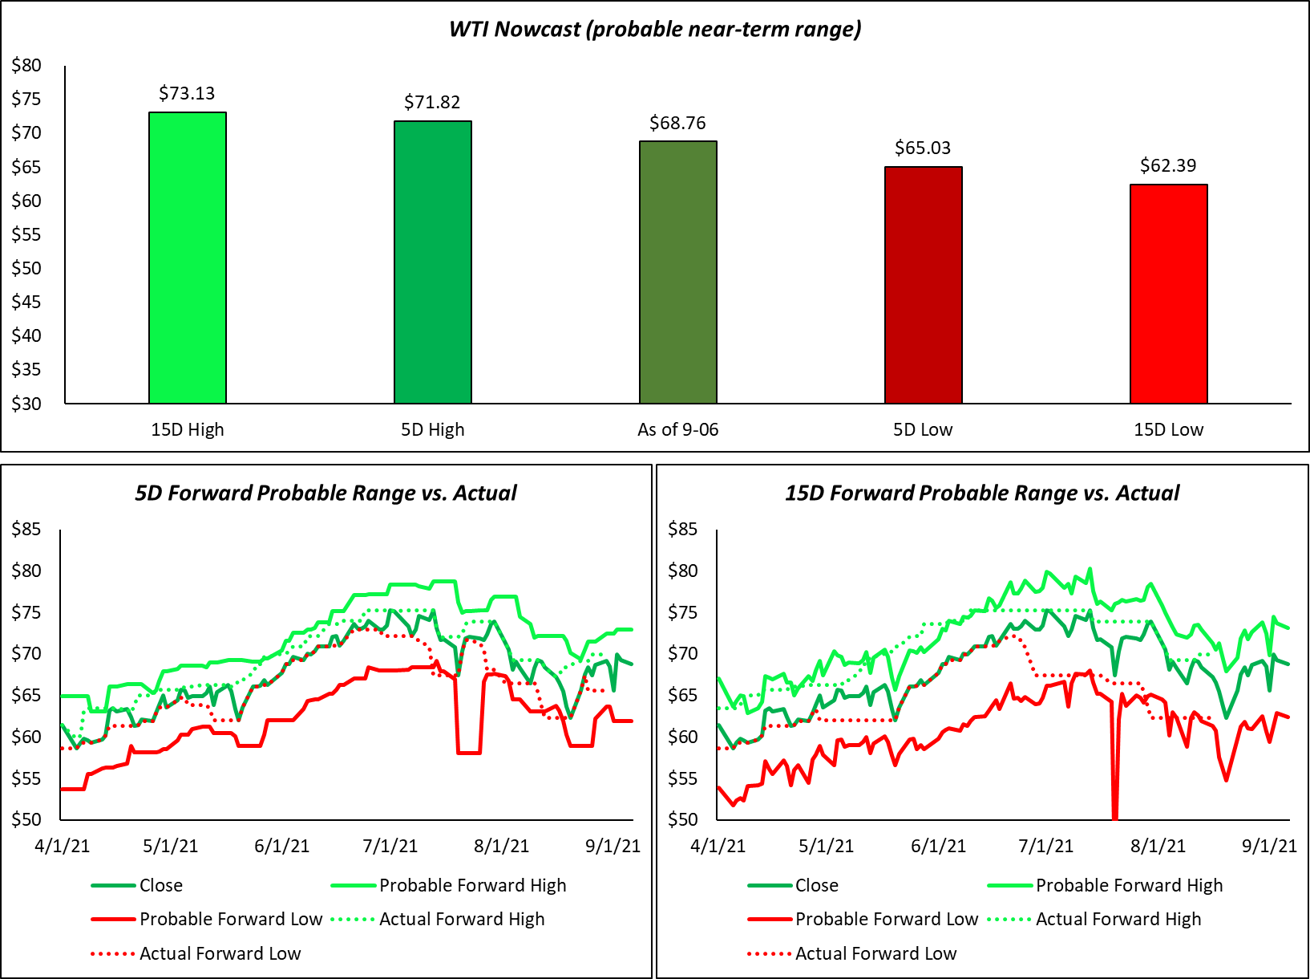
Existing subscribers will be familiar with the below. For new subscribers, I derive a forward probable range for WTI using volatility. I will have a whole post dedicated to this, as it is a critical part of my process. Briefly, the forward probable range is not a price target, but a range of outcomes based on the potential move in volatility over a 5 day and 15 day duration. In regimes where price momentum is positive, the low end of the range represents a good opportunity to increase net length. On the flip side, in a negative momentum environment, the top of the range represents a good opportunity to decrease net length/increase short exposure. A good friend built a whole company called MyFractalRange around volatility based ranges for any security with a ticker. I highly recommend taking a look at their product.
Disclaimer: This is not investment advice. All of the views are my own, and not representative of Donovan Ventures, LLC or Energy Founders Fund, L.P.