
Gas has arrived. The upside?
Gas has arrived. The upside?
Much cooler weather needed for front-month upside, back-end remains attractive.

Godot finally arrived.
The usual title for natural gas outlooks is something like “Gas or Godot, who will get here first?”. This winter, a combination of near record summer demand, a global shortage of resources for power production and capital restraint domestically have driven natural gas prices (domestically and globally) to multi-decade highs and have bulls saying Godot (gas in this case) has finally arrived.
Wrong outlook...
I put intellectual honesty at the top of my priority list, and will always admit when I am wrong. I look at my underlying assumptions and then determine how reality either converged, or diverged from those assumptions. If the data changes, I change. A quick lookback to a post I made in May, where I walked through various dynamics in the domestic natural gas markets. My biggest assumption that drove my call for a cap in gas prices was accelerating activity in response to higher prices. That relationship has undergone a phase transition, and operators have held production acceleration in check (Toby Rice big proponent of flatter production). Simply put, the volumes have not shown up like I thought they would.

“You don’t have to be right, just make money”
This is a phrase I learned from a very successful investor, with an incredible long-term track record investing in public equities. In every investment (or trade), I think 1) how do I not lose money, and 2) if I am wrong, how can I best position the trade to still generate a return? The way I structured the expression of my natural gas view in the aforementioned twitter thread was going long Antero Resources, and EQT Corporation vs. a short basket of CNX Resources, Cabot Oil and Gas, and Southwestern Energy (on May 7th, 2021). While I was wrong on the price outlook of natural gas, the long AR/short SWN pair is up 80% since that post. My short leg of the other pair trade was cut short when Cabot and Cimarex announced they were merging. I fully covered the Cabot short on the announcement (May 24th, 2021), at which point the pair had returned 7.9% (over a 17 day period), and left CNX short on. The long EQT/short CNX pair peaked at +15% on September 28th and has pulled back to -10% as of close Friday.
Feeling that summer heat
The summer of superlatives included natural gas and near record warm weather. Starting with the weather. Entering summer, cooling degree days were near average, but a late surge in warm weather drove cooling degree days to the fourth highest in 20 years at 353 (August total). This is compared to a max of 374, average of 324 and low of 254. Years exceeding 2021 included 2007, 2016 and 2010.

Power consumption responded to that heat, and jumped to 13.6MM MWh (weekly average) in late August, which was ~6% higher than average since 2008.
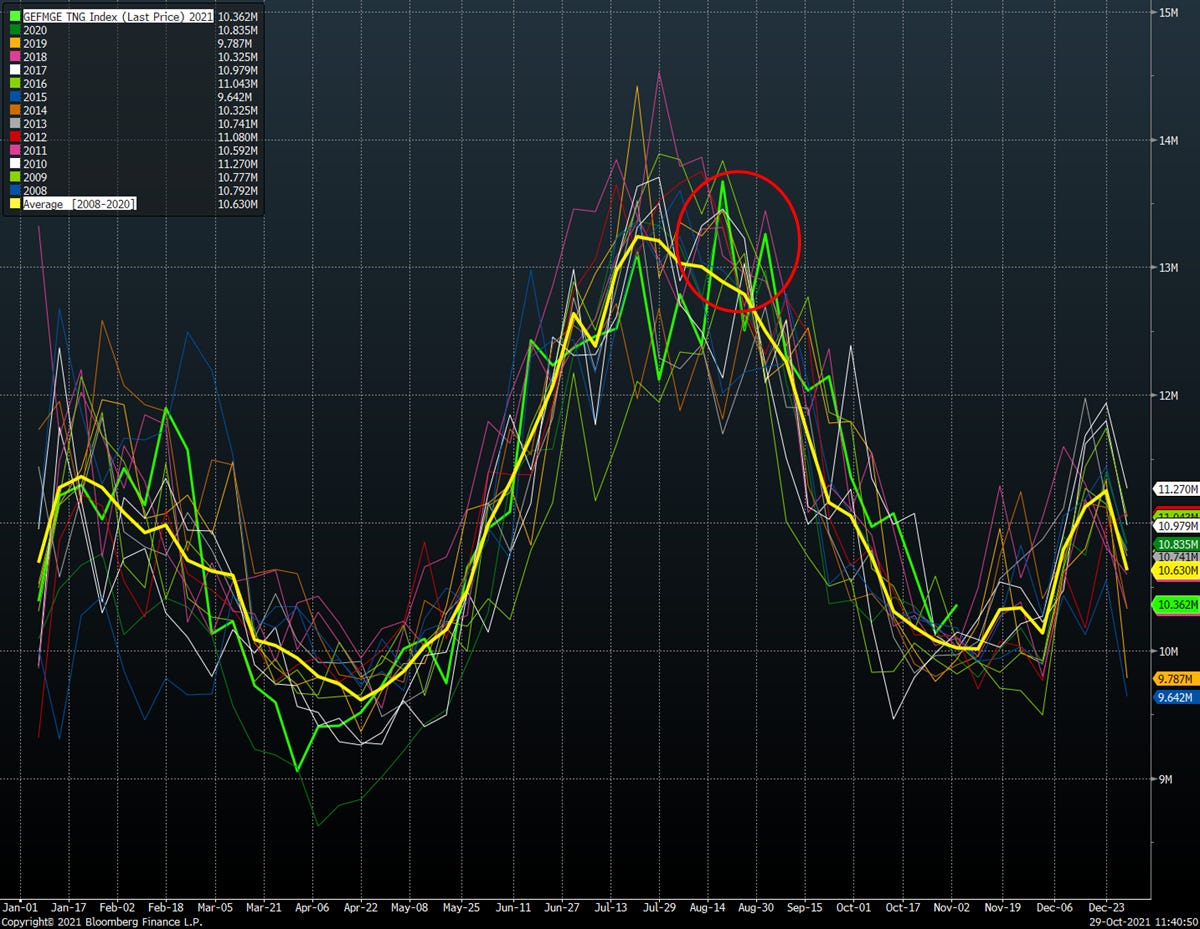
On the gas side, consumption for power generation hit a record for late summer, and near record for the entire summer (since 2009). Consumption reached 42.6 Bcf/d during the first week of September, which was 32% higher than the seasonal average and a record for the same week across the last 12 years.

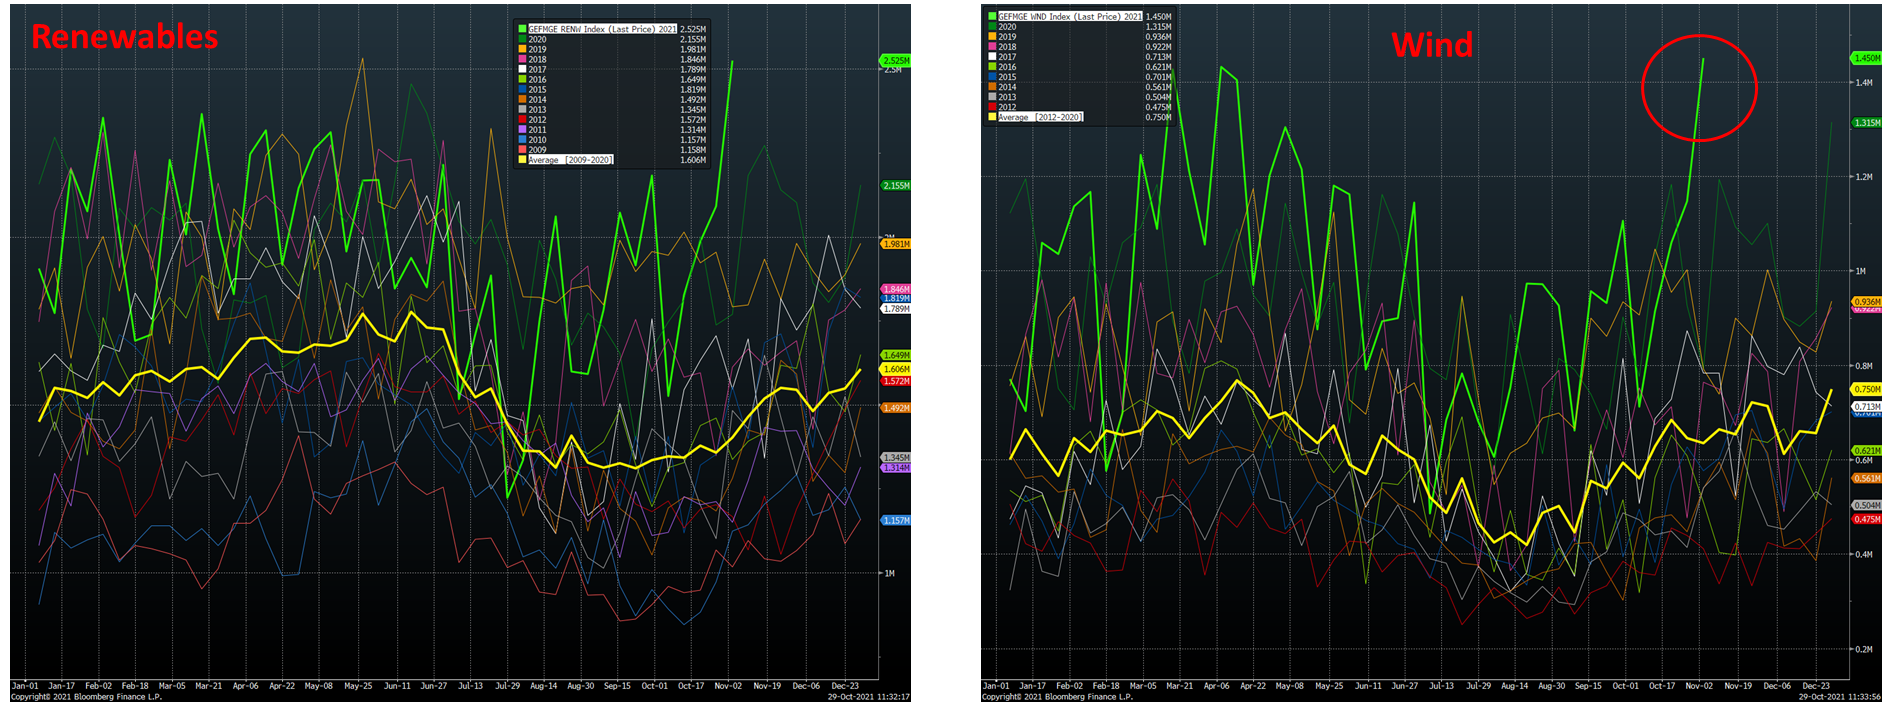
Led by wind generation, renewables have accelerated to 2.5MM MWh (weekly average) as of the most recent data. Wind generation represents a whopping ~57%. The implications for renewable power generation in 2022 should not underestimated, and a topic I will cover in more depth over the coming months.
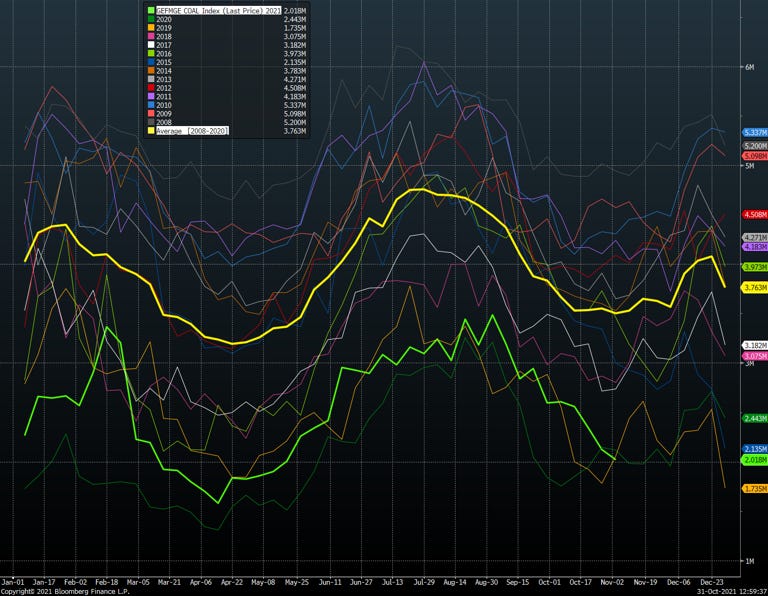
Significant efforts to reduce carbon emissions domestically have led to coal retirements, and declining generation capacity. Currently coal generation is ~43% lower than the seasonal average since 2008.
Where are we now?
The near record demand for gas fired power generation, combined with muted supply acceleration led to inventories exiting summer with only 48 days of implied storage (storage over total gas consumption). This is the second lowest level since 2009.
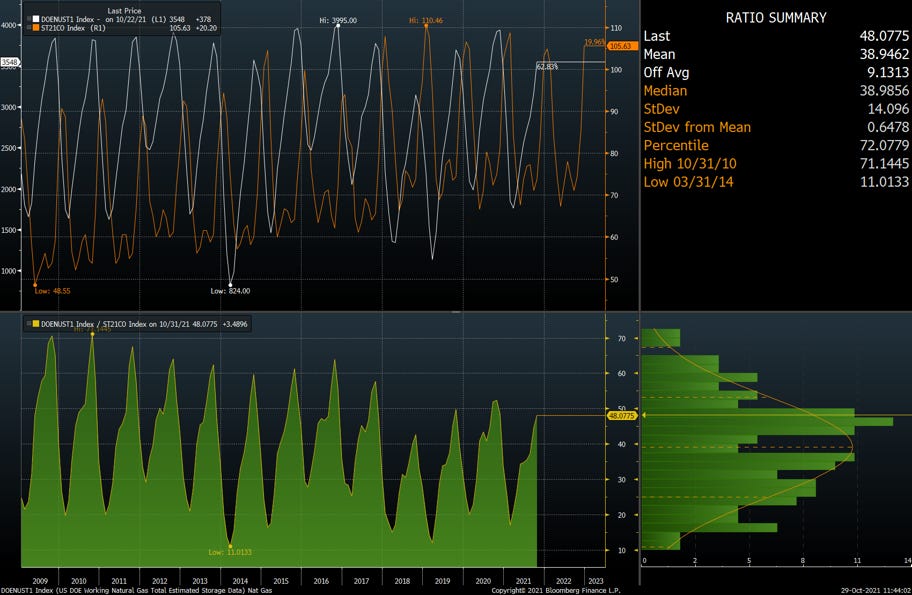
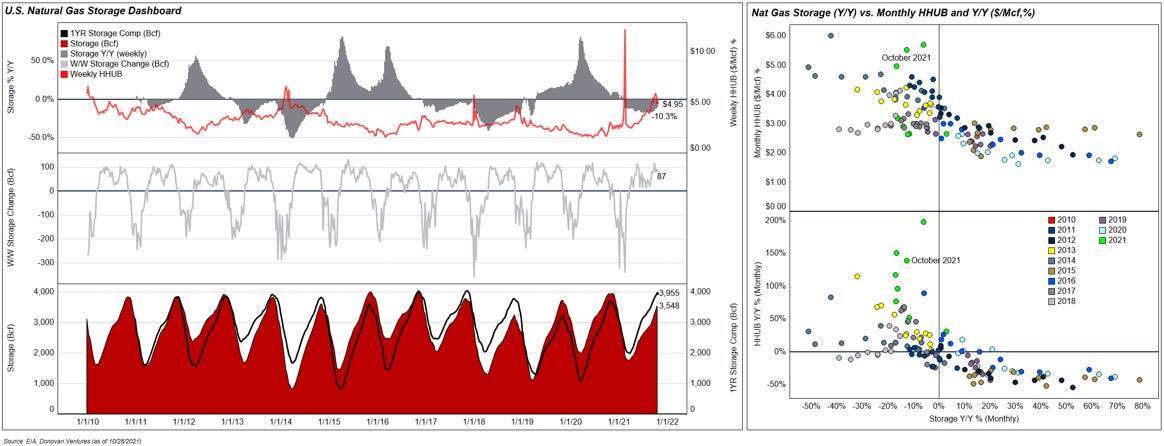
Expanding further on inventories. Below is a dashboard I like to look at on a weekly basis. The top left panel is comparing Y/Y inventories vs. HHUB gas price. Build season slowed significantly due to the aforementioned factors, and storage troughed at -17.8% Y/Y. Price responded accordingly and surged to a peak of $6.32 in early October. The middle left panel is a look at W/W changes in storage, and the bottom left panel is a comparison of current inventories vs. the 1YR comparable period. The right panel is a look at the relationship between storage Y/Y and HHUB ($/Mcf)/ HHUB (Y/Y) on monthly basis. When storage is decelerating, price is typically accelerating.
It is hard to argue summer injection season was anything but bullish. However, the pivot from injection to draws in storage is nuanced, and critical when estimating price upside for winter.
The pivot
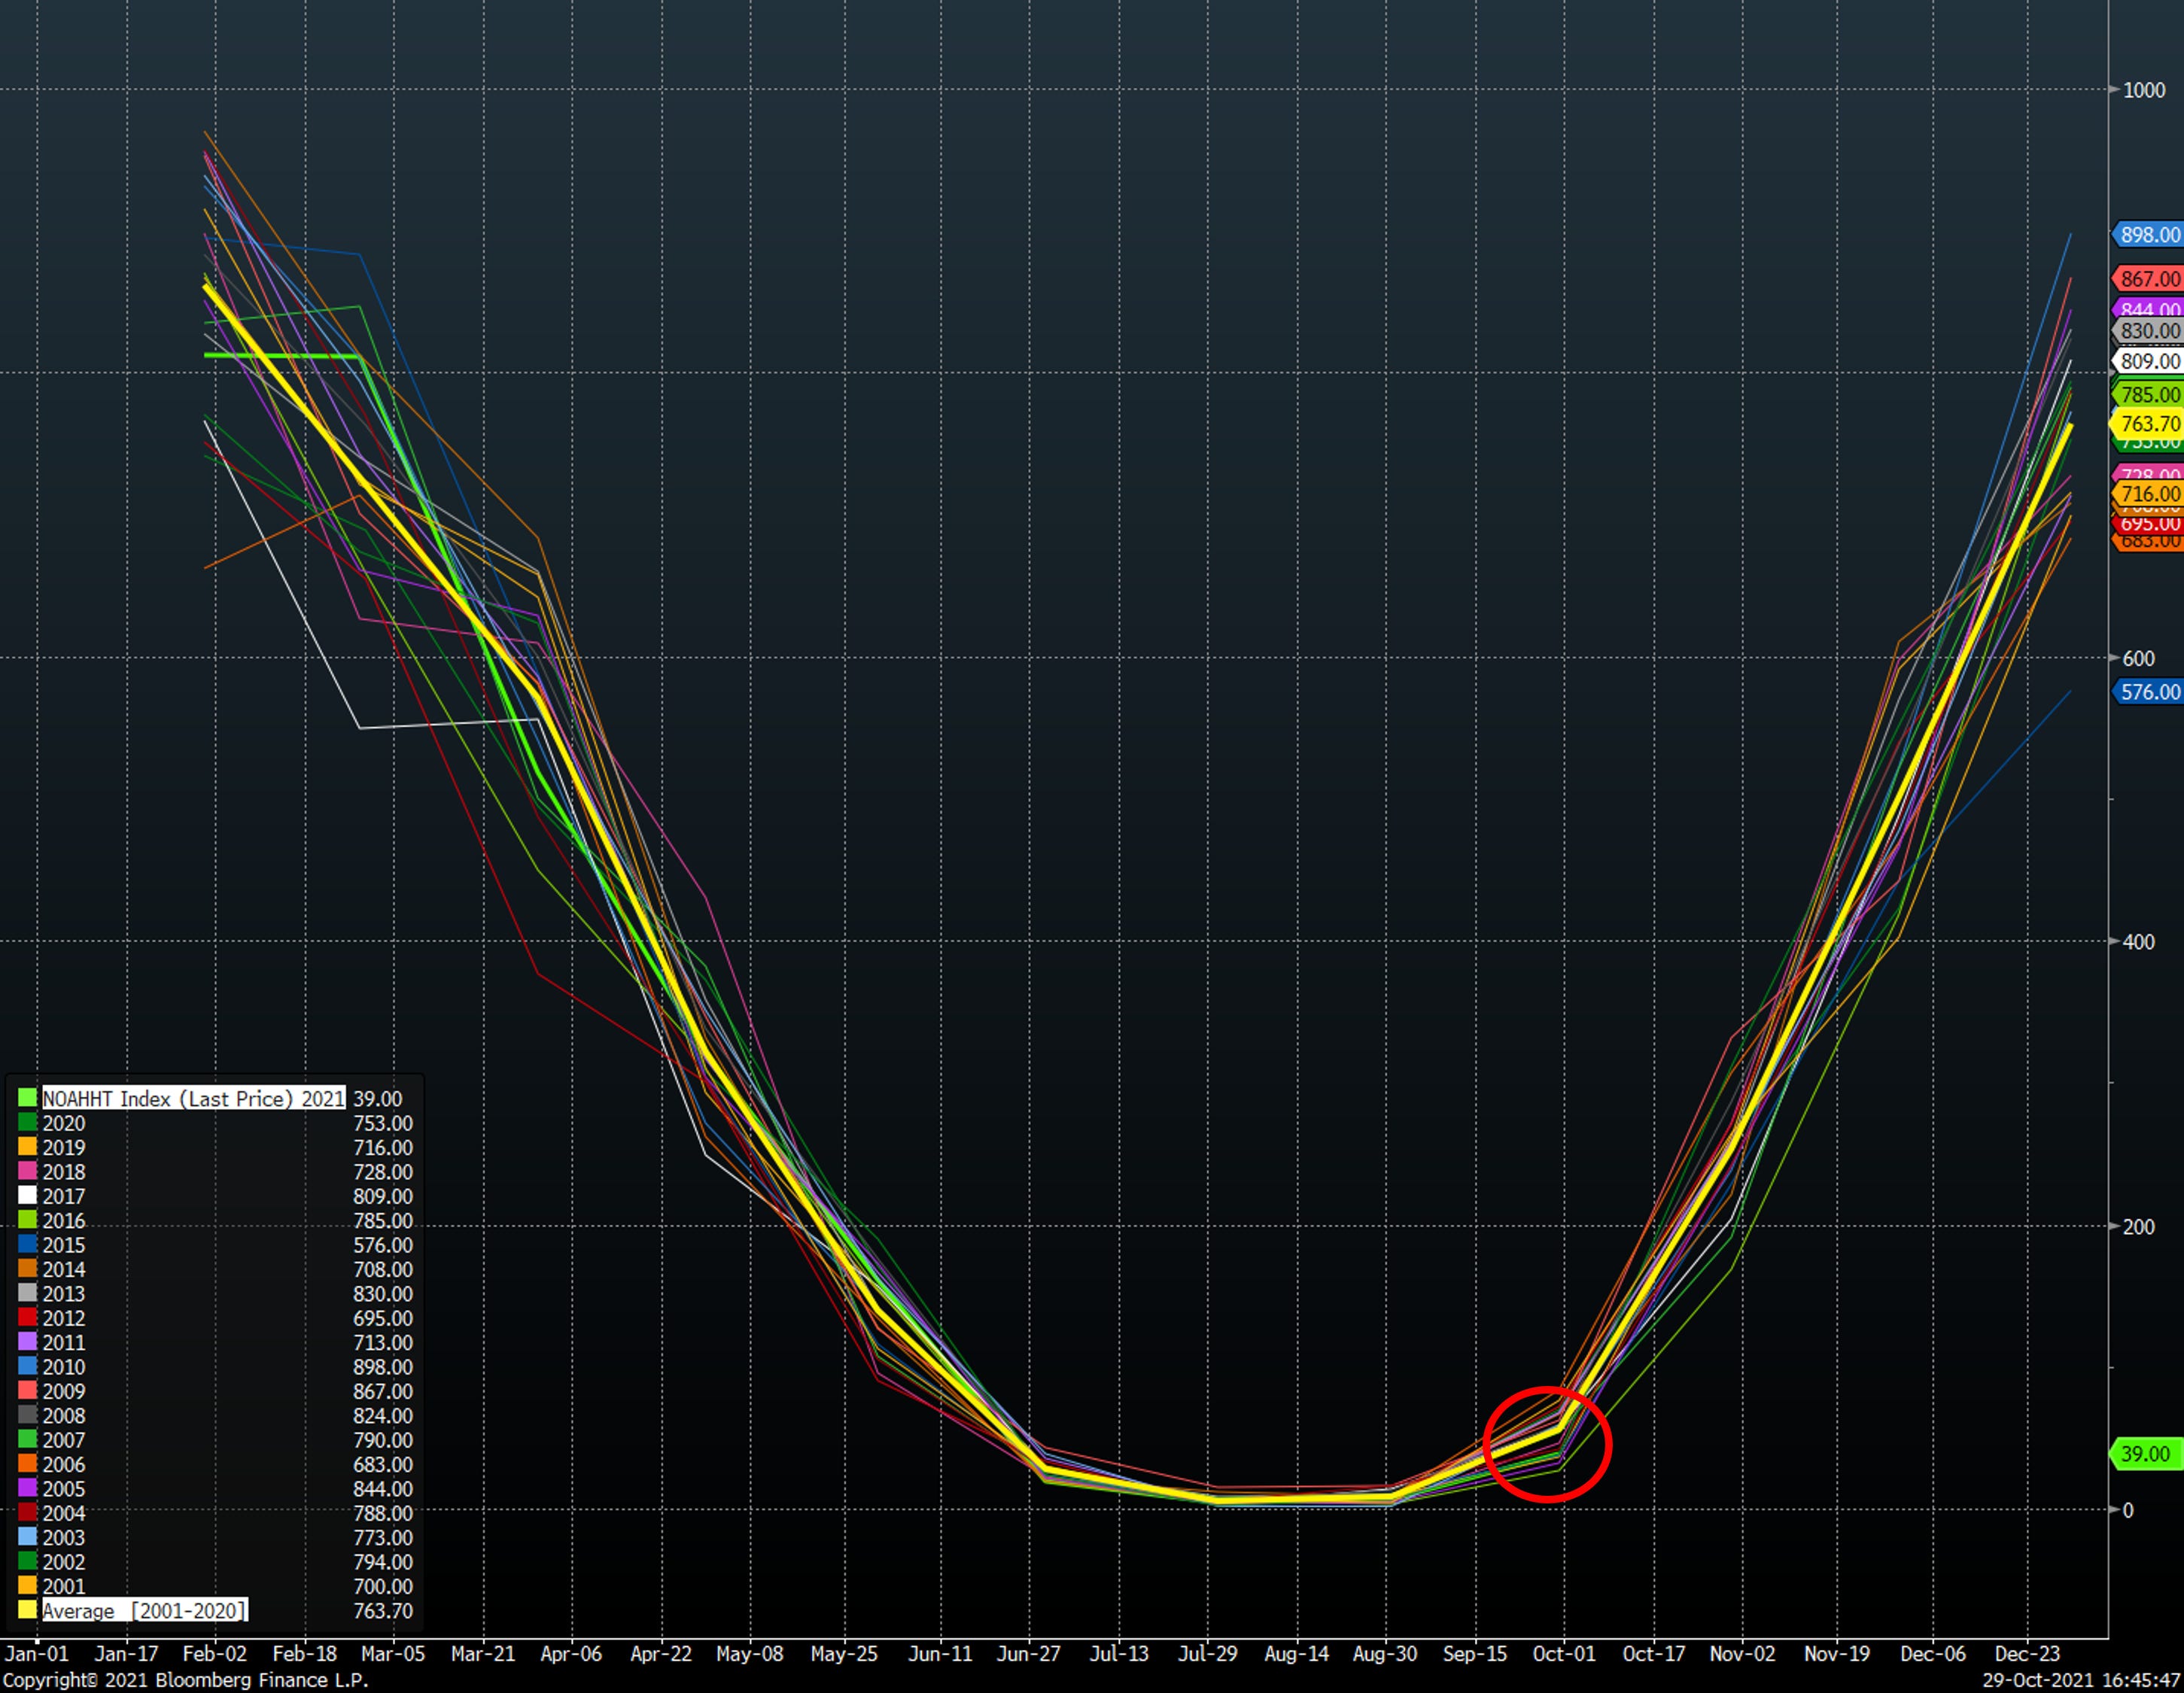
Summer weather, while beneficial to gas demand, lasted much longer and drove a much warmer September and October than average. The handoff between cooling degree days and heating degree days is important, and most important is the acceleration of heating degree days in November. September heating degree days of 39 were 30% lower than 20 year average of 55. September was the 6th lowest reading over that time span, with 2002, 2005, 2015, 2016 and 2019 lower.
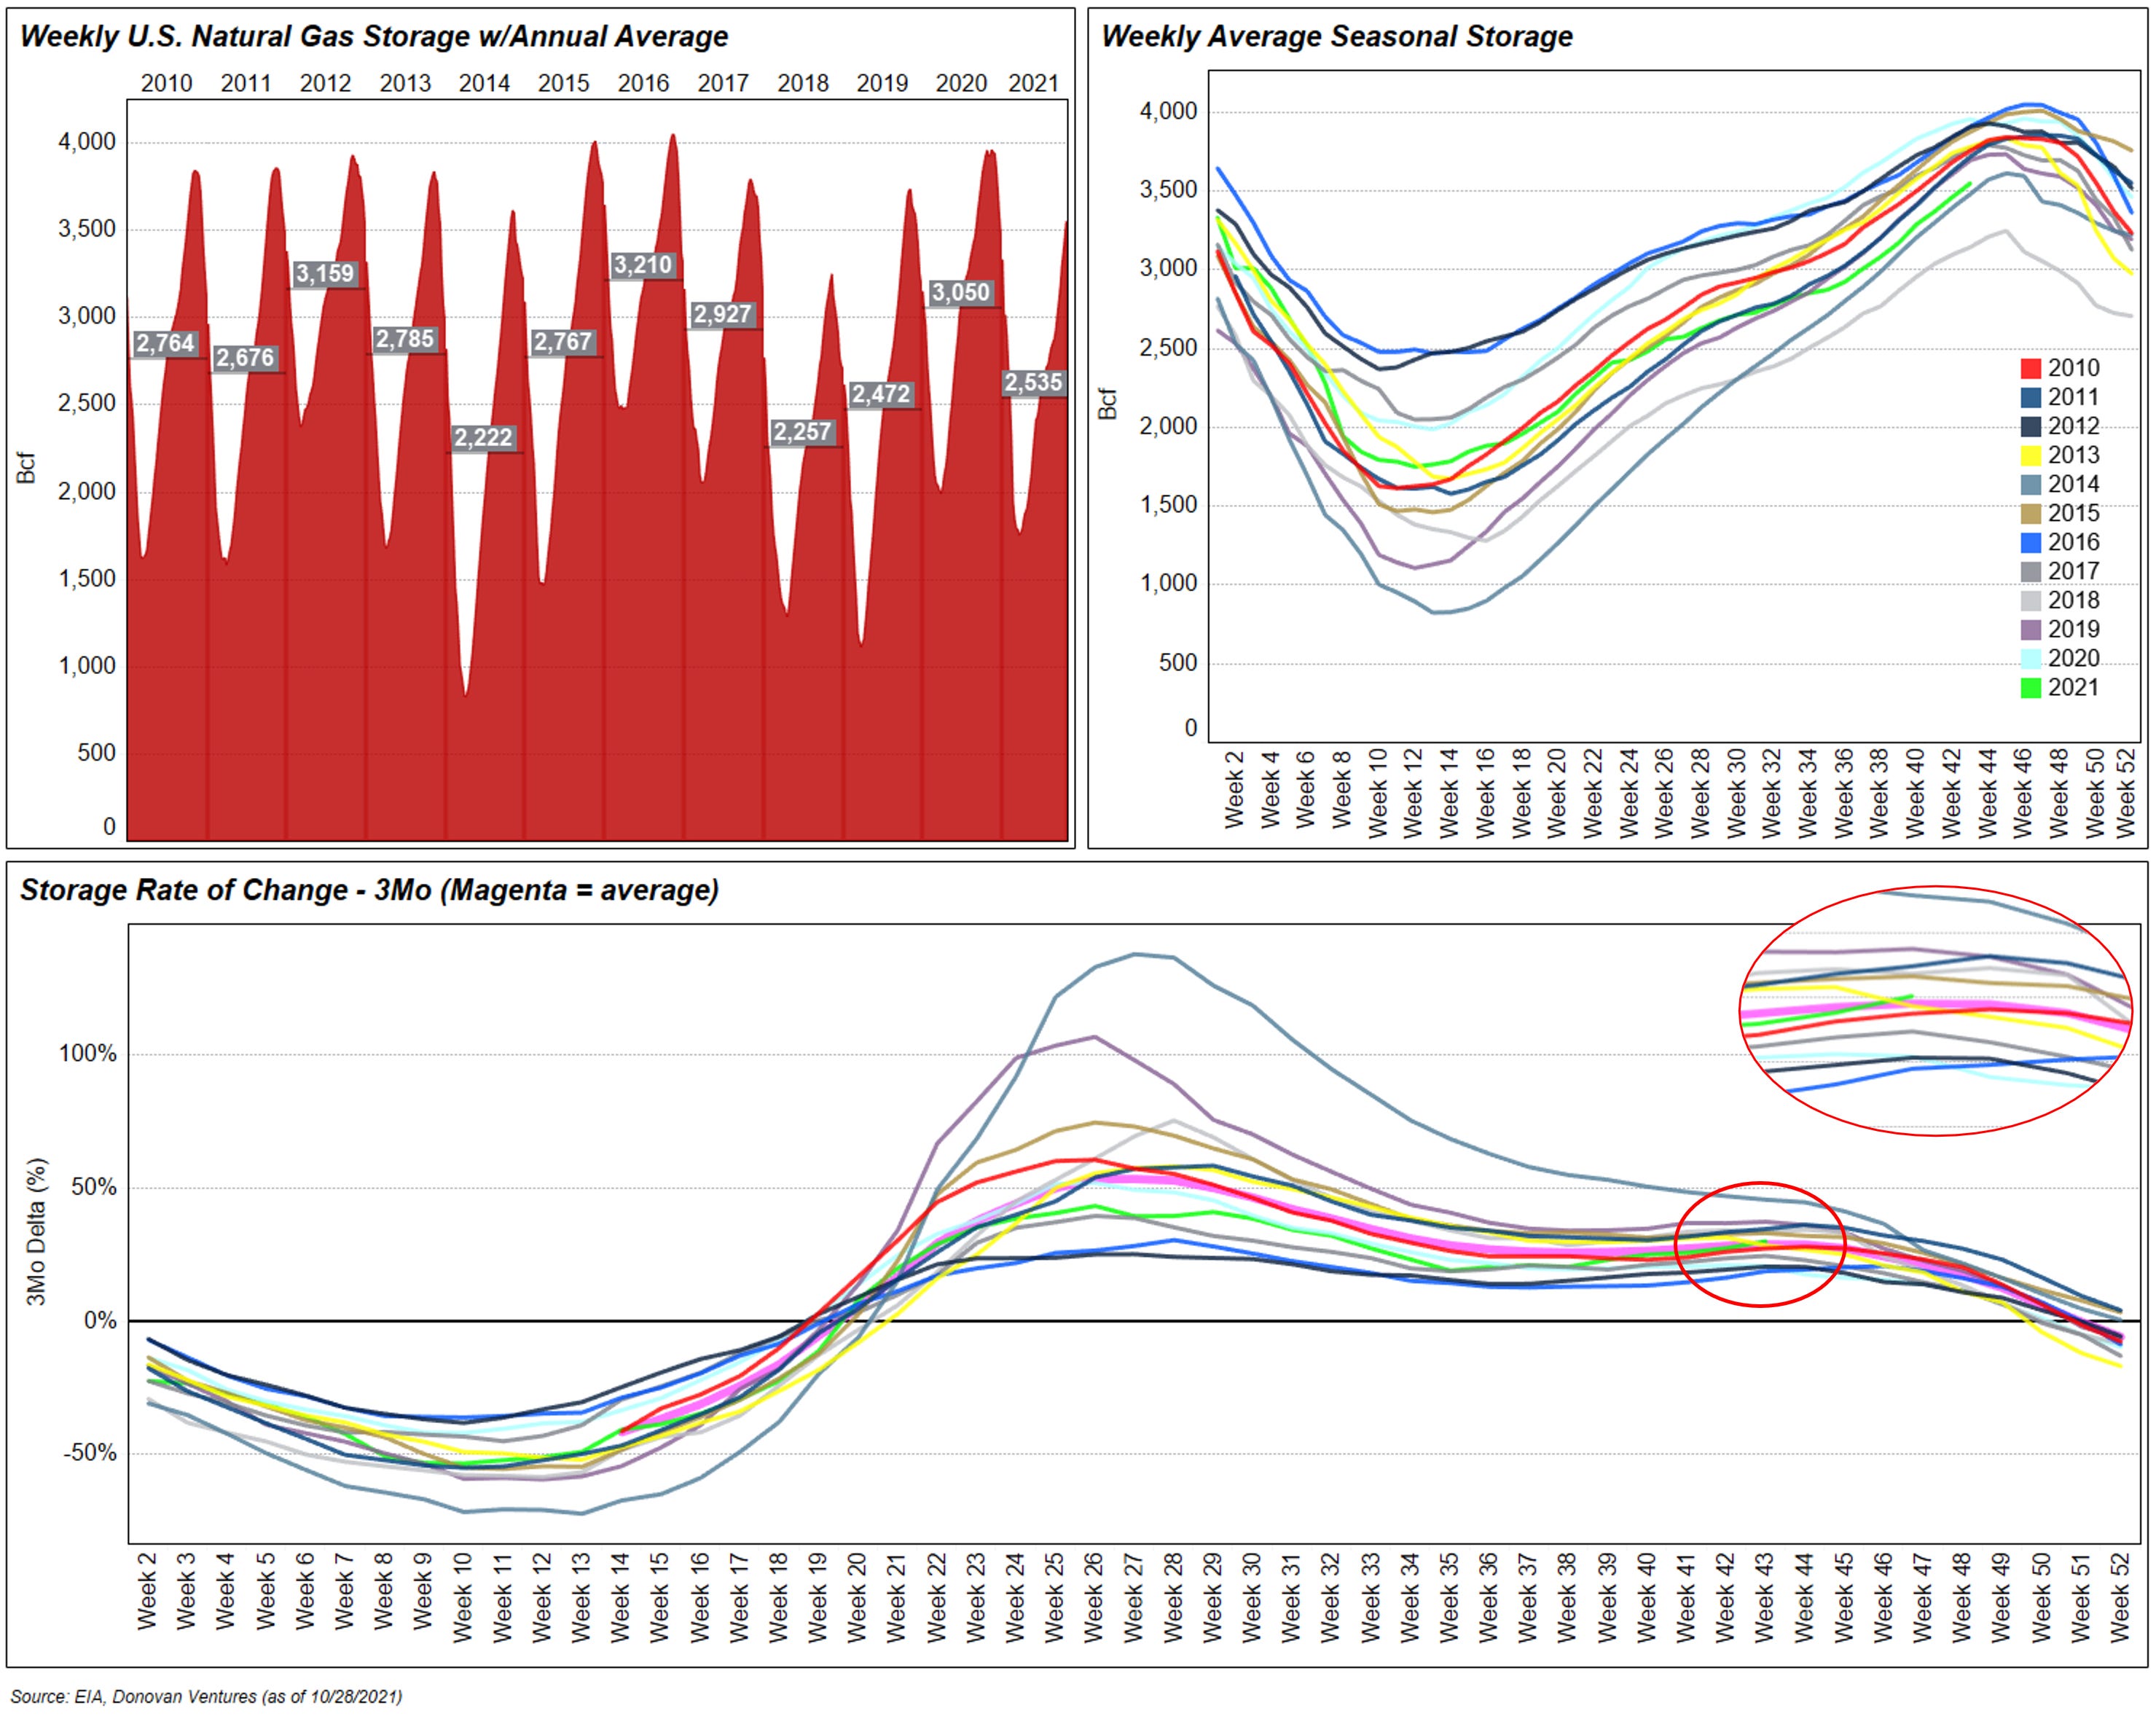
The limited acceleration in heating degree days drove an above average acceleration in storage for October. In the bottom panel of the graphic below, I am charting the rolling 3-month acceleration in storage. It is slightly hard to see, but recently storage has accelerated just above seasonal norms.
Next, the Forecast
Long-range forecasting in weather is an incredibly difficult task, so I look at a range of outcomes and their impacts on storage. I would be remiss to not include a forecast here. Currently, long-range forecasts have this winter at normal to slightly above normal temperatures.

A weather service I like to follow, Bamwx weather, generated the below degree day forecast compared to their analog data set, and the 10YR and 30YR averages.
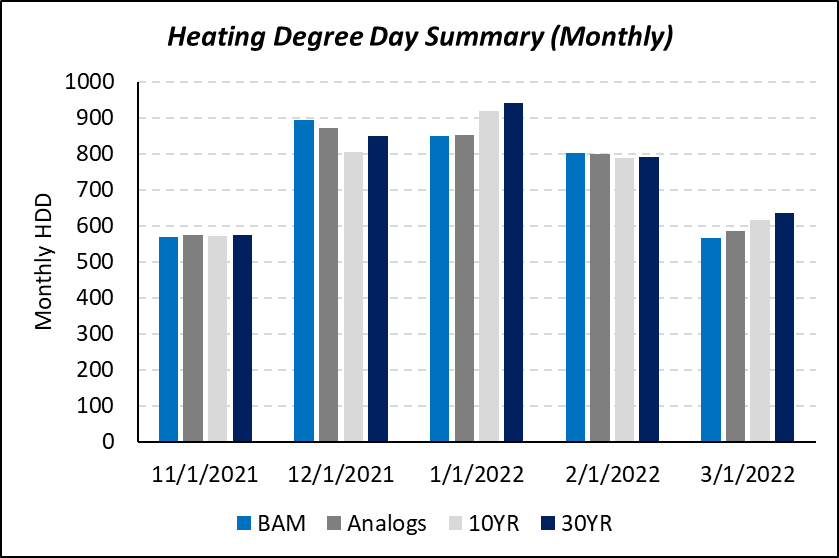
For HDD forecasting purposes, I utilize the 10YR and 30YR averages, the BAMWX forecast, and their analog data set. A quick summary of why degree days are so important to storage. Below is a look at the daily average total degree days (Heating + Cooling, prior week) vs. the W/W change in natural gas storage. Across the last 20 years, the relationship between these two metrics has a 0.94 R2, and P-value ~0.

Reiterating, nailing degree days 3+ months out is nearly impossible, so back to a probabilistic approach. Below is the range of outcomes I generated using the various degree day forecasts. The estimate case is utilizing the BAMWX degree day forecast, and the high case is the max degree days over the last 10 years. One case that I am not including, but I did run the math on is the “out of storage” scenario. This is a draconian scenario, but we still need to be aware of this outcome. For the out of storage scenario to play out, we need to see a winter that is 15% colder than the 10YR average. This would lead to storage running out in the last week of March. In that scenario, it is all bets are off and gas goes hyperbolic a la Shiba coin.
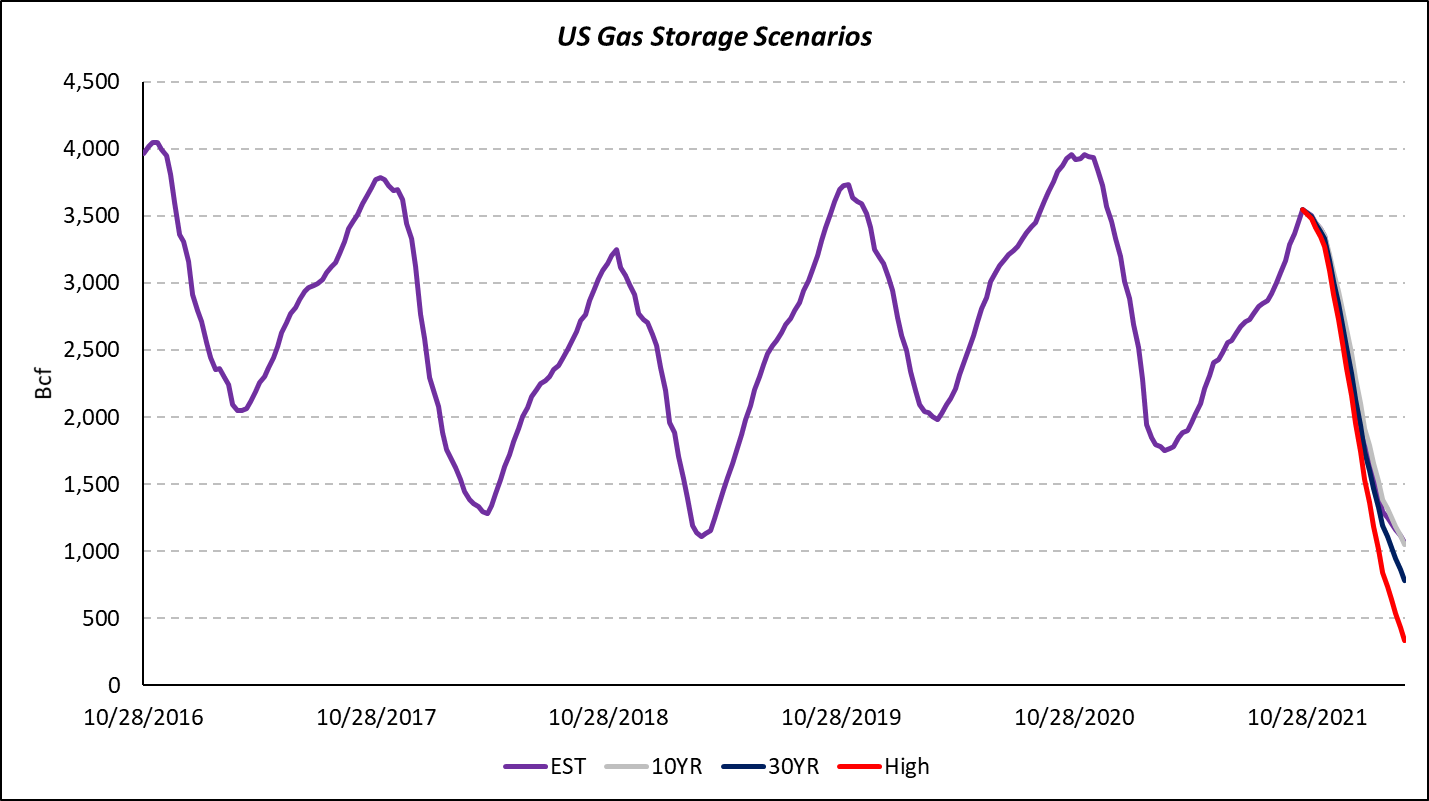
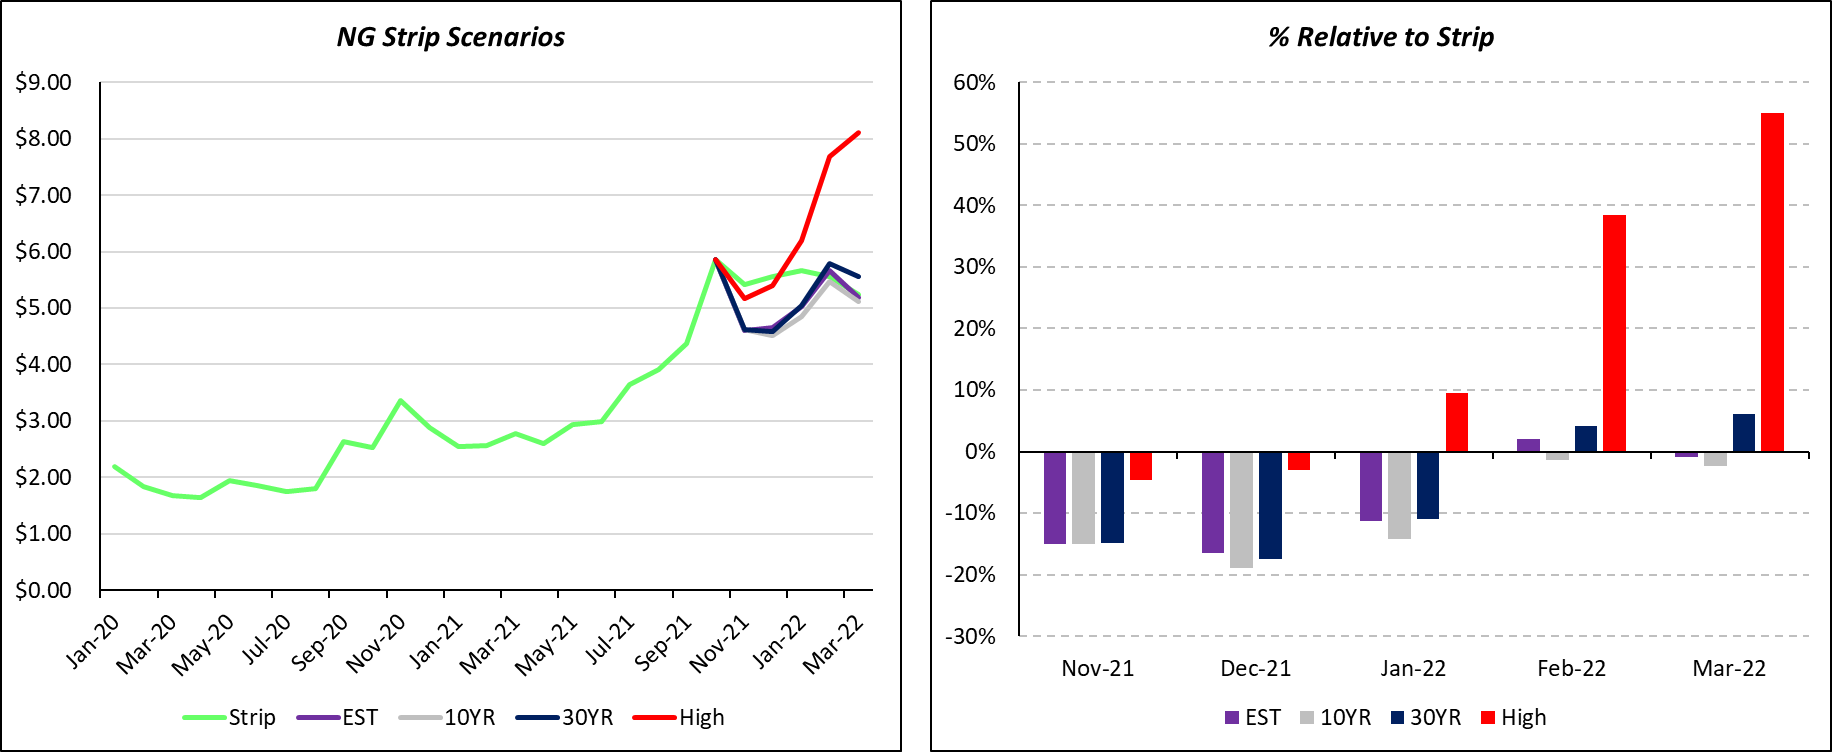
The main reason I started out on the path of forecasting storage, was to determine various price paths and how much upside is left relative to strip. Those cases drove the below, which implies there is limited front-month upside.
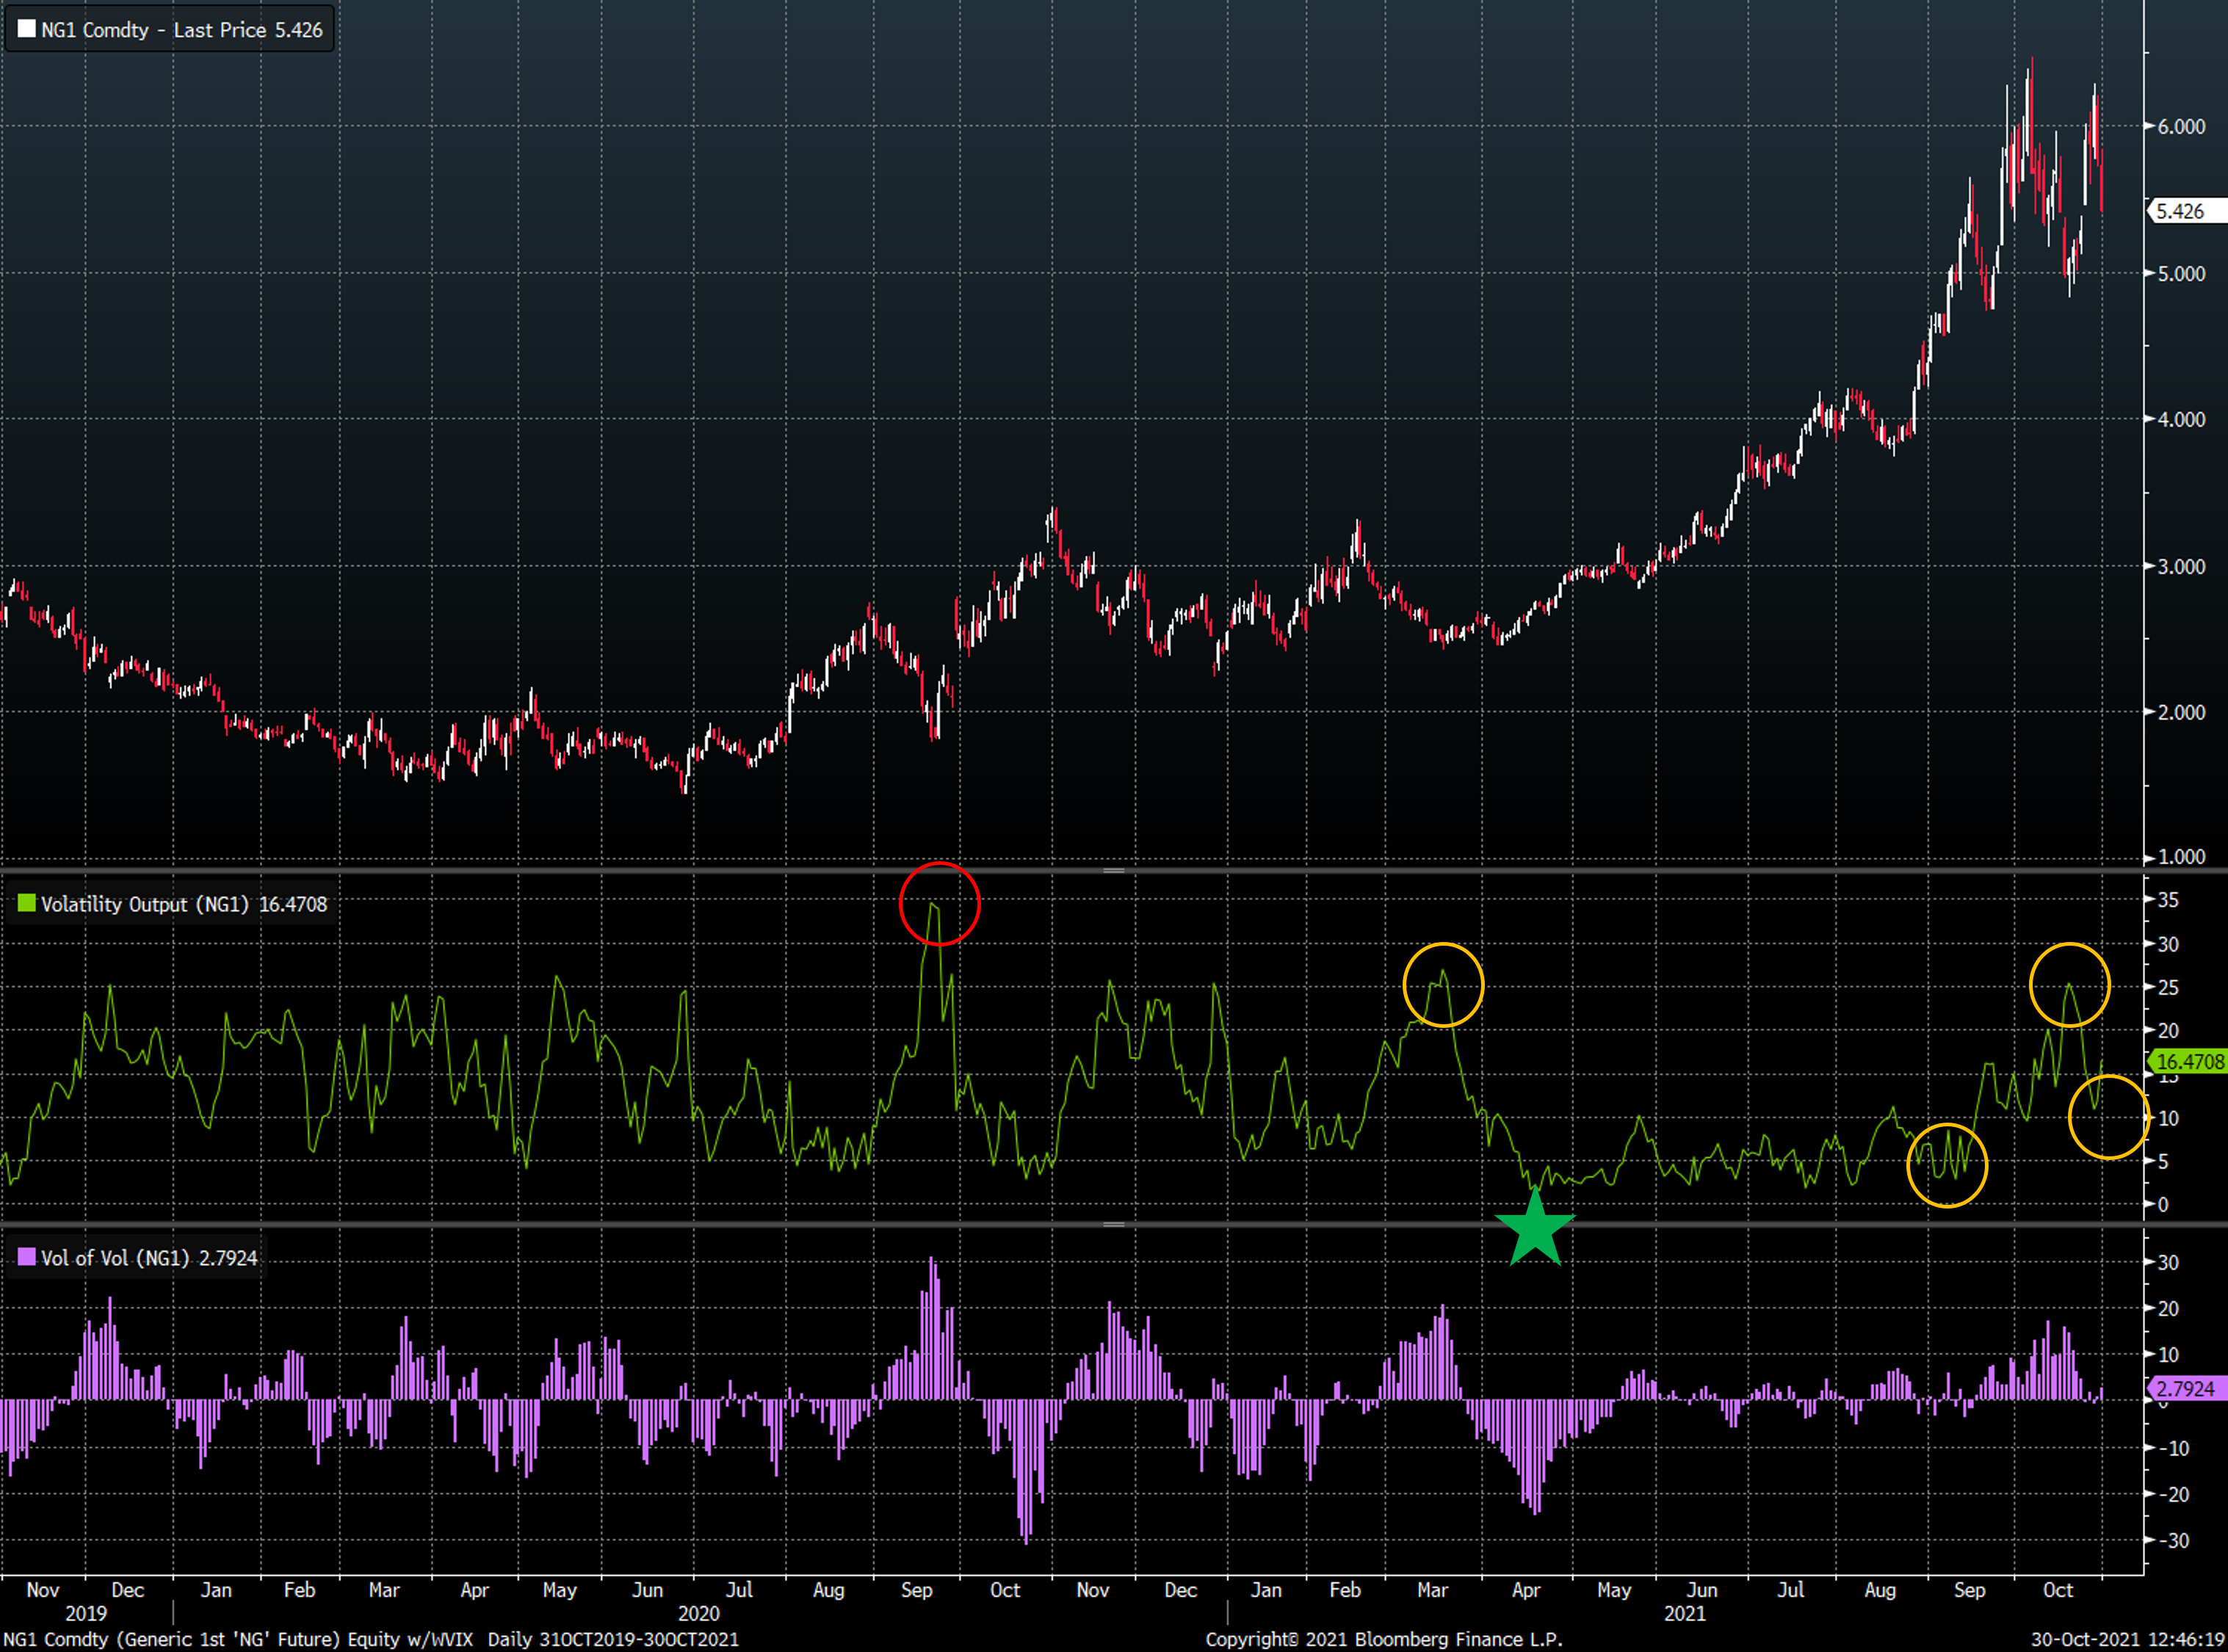
That is the fundamental outlook, but what about the market side? In the chart below, I plotted NG1 (active gas contract) with volatility and the monthly change in volatility in the bottom panel. In early 2021, volatility bounced off a big lower high (first orange circle), which is very bullish if confirmed with lower lows in volatility. The lower low in volatility occurred in mid -April (green star), and preceded a 140% move to cycle highs in October. More recently, the acceleration in volatility is a warning shot as we enter winter. Higher lows in volatility, and the change in vol remaining persistently positive, make me cautious of adding to natural gas weighted exposure near-term. Positioning wise, I have reduced net exposure to nat gas weighted names and the underlying commodity. However, I am not going net short. The pieces that would drive positioning net short are continued rise in volatility (failure to make lower low) and warmer weather outlooks across the Northern Hemisphere. The last piece I will highlight here is all of the dynamics are on the front-end of the curve, I fully expect the back-end of the curve to continue rising. I will have a full post dedicated to the 22’/23’ dynamics, and the short answer is we need gas volumes badly. Otherwise, expect strip to run well over $4/Mcf.
The factors I have not covered here, but will follow up with in a second post are the following:
1) Gas to coal switching - likely non-existent this winter due to coal prices, and potentially coal to gas switching on a regional basis. Historically, high gas prices have driven switching to coal fired generation.
2) Activity acceleration - while activity acceleration has been limited to this point, rigs in the Appalachia, Haynesville and Cana Woodford basins are up 36% Y/Y. Additionally, rigs in the Permian Basin are up 89% Y/Y. The gas is coming, but will be too late for this winter.
3) LNG export additions - several LNG trains are likely to come online during 1H22’. This is more impactful for back-end of the curve.
4) Appalachian Pipeline capacity constraints - continued rejections of newbuild pipelines are likely to limit acceleration in Appalachian dry gas production.
If you found this analysis helpful, please feel free to forward to your colleagues and anyone interested in the energy markets!
Disclaimer: This is not investment advice. All of the views are my own, and not representative of Donovan Ventures, LLC or Energy Founders Fund, L.P.