All gas, no brakes.
Fundamental shift in domestic mobility likely a secular tailwind for oil demand
Buy Buy Buy!
If you have tried buying a car (new or used) over the last year, you have probably found the process to be very frustrating (more-so than prior years). A combination of supply chain issues and surging demand have driven inventories sharply lower and price much higher. There are two sides to the demand coin. New car sales are down ~23% vs. 2019 (pre-pandemic).
However, used car sales are through the roof at +40% vs. 2019. A component of this surge is in pricing (+24% Y/Y as of mid-September), but the main driver is volume. One important caveat here is the deceleration in sales from +58% in March 2021 to +40% currently (both vs. 2019). The pace of deceleration through year-end is a critical component to watch, since used cars have driven incremental acceleration in gasoline demand.

Where are the cars?
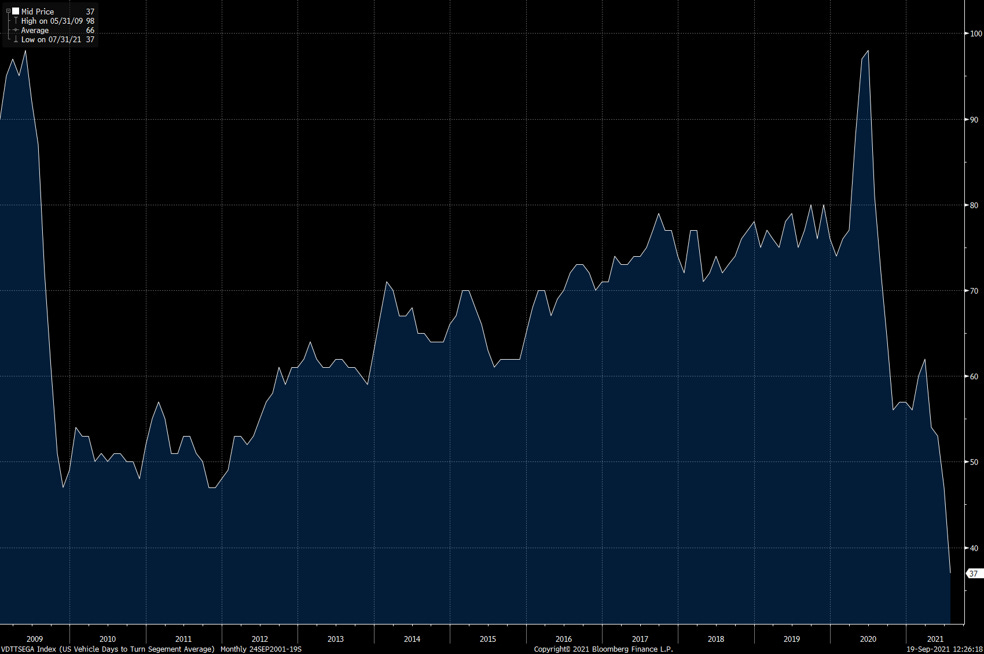
Inventory is getting harder to find, and that can be seen in the data. Days to turn, a measure of how long it takes to turn over the car inventory on a lot, hit an all-time low in July at 37 (over measured data since 2009).
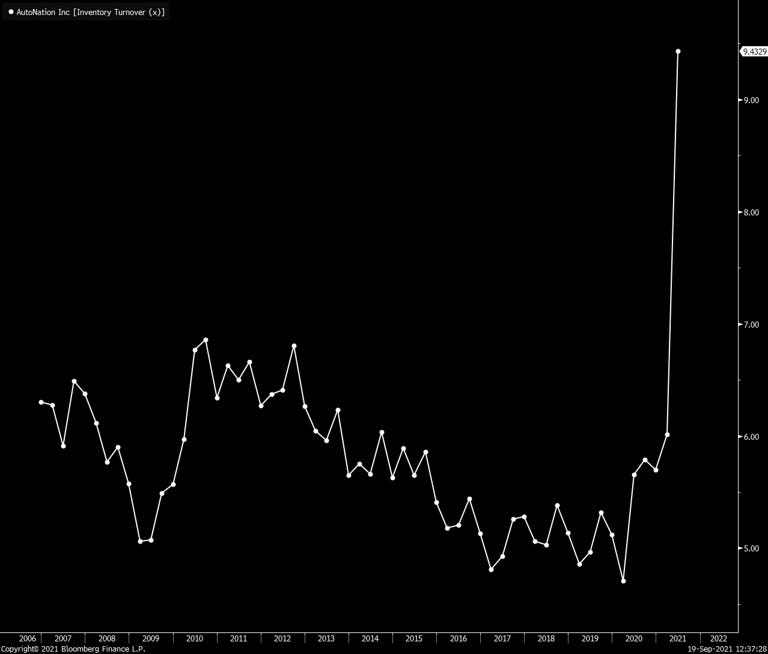
On the used car front, inventory turnover (calculated as sales divided by average inventory, higher number means faster turnover and less implied inventory) has accelerated to multi-year highs. CarMax inventory turnover hit an 8 year high in 2Q21’, while Auto Nation's hit an all-time high during the quarter.
The inventory picture leads to two conclusions: 1) price acceleration will drive buyers out of the market and reduce demand, or 2) demand will remain resilient and drive new car sales to re-accelerate. The main data points I suggest monitoring going forward are the acceleration (rate of change) in new car sales (highlighted above), and used car pricing. Other data points to watch are sales figures from CarMax, AutoNation, Hertz, and Carvana. The scenario where new car sales accelerate with elevated used car pricing (ie. demand resiliency) is likely incrementally bullish for gasoline demand. On the flip side, if new car sales don’t accelerate and used car pricing remains elevated (ie. demand destruction), the tailwind for gasoline consumption is marginally lower. Next I am going to walk through the implications of more cars on the road for gasoline demand. Secular view first, then cyclical.
MOAR demand
For gasoline demand, all roads lead to VMT (vehicle miles traveled). This is a measure of the total miles traveled by vehicles on US roads. More cars on the road translates to higher VMT and more importantly higher gasoline demand. I will cover the much debated topic of electric vehicles at a different time, but in the short term (<5 years) the impact is not meaningful to US gasoline demand since they represent ~4% of car sales (~570,000 sold in 2020 vs. total new car sales of ~14.5 million). The growth rate is the debated piece, but if you look at California who has one of the most favorable policy stances for EV’s, sales have decelerated since 2018. 2021 has seen acceleration, but far below the pace seen from 2017 to 2018.
Back to the gas guzzlers. Since 2007, total car sales (used + new) have driven total car registrations in the US higher. Over that time period, the is a strong relationship with an R2 of 0.69. When looking at just new cars sold vs. registered vehicles, that relationship drops to a 0.6 R2. Comparing to used car sales only, that figure increases to 0.95. Used car sales matter.
More cars on the road drives VMT higher, and in turn gasoline demand higher. Since 1995, annual VMT vs. annual registered vehicles has a 0.9 R2. On the demand side, average annual gasoline product supplied (implied gasoline demand) has a 0.91 R2 vs. annual VMT. The bottom line is more total car sales, drives more gasoline demand over time.
The Cycle
That is a secular view, but what about the current cycle? After plunging to -40% vs. the 2YR comparable period at the height of the lockdowns in 2020, VMT has accelerated back to -0.7% vs. 2019 levels. It is likely we see this figure hit 2019 levels when the data is reported for 2021’s peak driving season (July/August).
In 2020, gasoline product supplied accelerated from 5,065 Mbbl/d in April 2020 to 8,896 Mbbl/d in October 2020. This represented a massive 46.5% acceleration when compared to the 2YR comparable period. Nominally, demand increased at an average pace of 141 Mbbl/d per week, over the course of 27 weeks. A re-acceleration in covid cases, combined with winter storms, drove a deceleration in implied demand to -19% vs. the 2YR comparable period (7,207 Mbbl/d) in February 2021. After covid cases rolled over, demand re-accelerated to an all-time high print of 10.04 Mmbbl/d in early July.
That brings us to today, where over the last 10 weeks, demand acceleration has flattened near 2019 levels (currently -0.5% vs. 2019). Impacts from Hurricane Ida can be seen in the latest data, but this is likely to normalize over the next 2 - 3 weeks (in terms of reported data). We typically see a decline in demand post Labor Day, which marks the end of summer driving season. Normally, as people return to work, demand re-accelerates until early November.
This is where I turn to the highest frequency fundamental data in my toolkit, mobility data as reported by Google. Their data is more reliable than Apple's, but you can do the math to verify. Below is a look at Retail/Recreation and Residential Mobility (% vs. Feb 2020 baseline) vs. gasoline product supplied for 2020 and 2021. Over the 83 weeks of reported data, Retail/Recreation Mobility and Residential Mobility both have a 0.81 R2 vs. gasoline product supplied. Culling out the initial month of data (pre-pandemic), the R2 increases to 0.87 and 0.89, respectively.
I use the above relationship to build a composite model to estimate gasoline demand based on mobility. The results of that model are below. I have not posted it here, but the relationship is similar for Global mobility vs. Global gasoline demand.
Below shows US mobility by type. I highlighted the two components mentioned above, and a third which is likely to be critical for incremental demand acceleration going forward. Workplace mobility has lagged with widespread work from home remaining in place. For mobility, this is a critical data point I will be monitoring closely. Accelerating workplace mobility is the incremental demand needed to drive gasoline consumption to all-time highs.
What does this all mean?
Risk management is never a game of knowing exactly what will happen next, but determining the likelihood of each outcome and positioning accordingly. Rate of change drives asset flows. If an asset class is not accelerating there is limited support for positive price momentum. For gasoline demand (and in turn domestic oil demand) acceleration, it is critical for total car sales to remain elevated and workplace mobility to accelerate.


